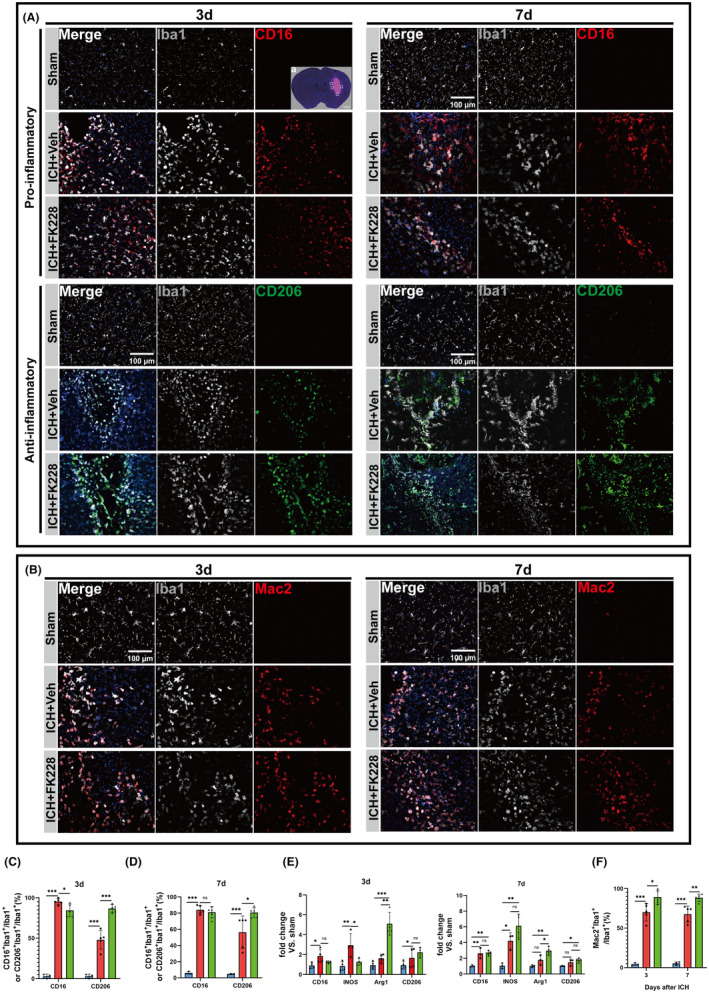
FIGURE 4.

HDAC1/2 inhibition modulates the heterogenization of microglia in vivo ICH model. (A) Sampling location diagram (scale bar = 1 mm). (A) Representative image of microglial heterogenization at 3 and 7 days after ICH, CD16 (Red), CD206 (Green), Iba1 (Gray) (scale bar = 100 μm). (B) Representative images of Mac2‐positive microglia at 3, 7 days after ICH, Mac2 (Red), Iba1 (Gray) (scale bar = 100 μm). (C, D) Quantification of CD16‐positive and CD206‐positive microglia at 3 and 7 days after ICH. n = 3 for Sham; n = 5 for ICH and Vehicle, n = 5 for ICH and FK228. (E) The mRNA expression levels of INOS, Arg1, CD16, CD206 of microglia were detected by RT‐qPCR at 3 and 7 days after ICH. 3d, n = 4 for per group; 7d, n = 3 for Sham; n = 3 for ICH and Vehicle, n = 4 for ICH and FK228. (F) Quantification of Mac2‐positive microglia among three groups at 3 and 7 days after ICH. n = 3 for Sham; n = 5 for ICH and Vehicle, n = 5 for ICH and FK228. All the data are presented as the mean ± SD. One‐way ANOVA test and Bonferroni post hoc (C–F). *p < 0.05, **p < 0.01, ***p < 0.001, ns: no significance.
