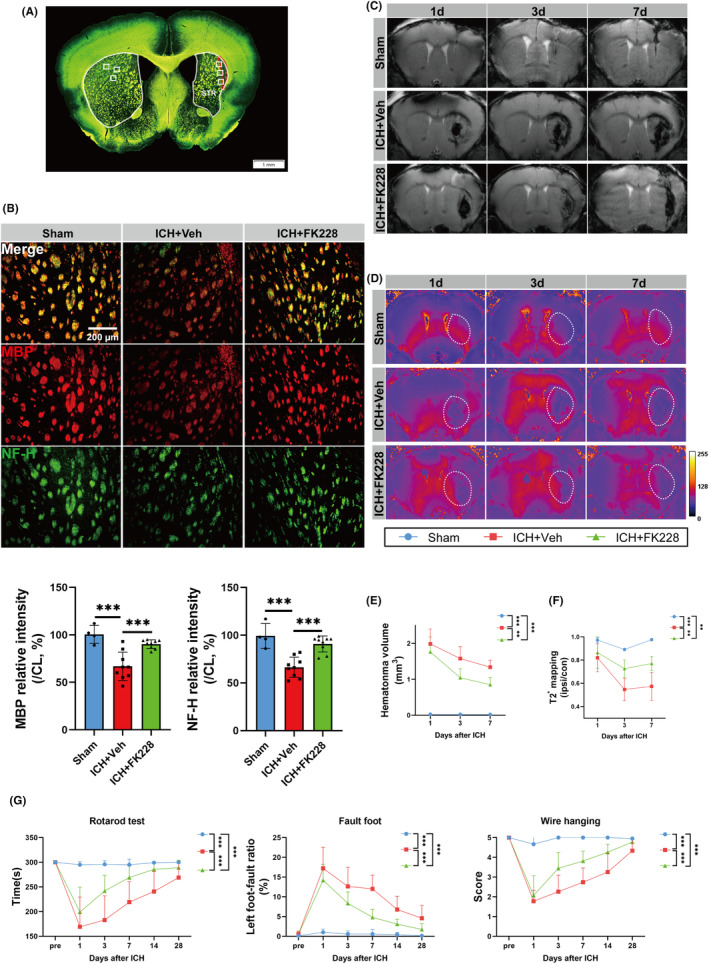
FIGURE 6.

HDAC1/2 inhibition accelerates the clearance of hematoma and mitigates the neurological deficits in vivo ICH model. (A) Sampling location diagram (scale bar = 1 mm). (B) Representative immunostaining image and quantification of MBP (red) and NF‐H (green) at 35 days after ICH in vivo. n = 4 for Sham; n = 9 for ICH and Vehicle, n = 9 for ICH and FK228, (scale bar = 200 μm). (C, E) Coronal SWI images of radiological hematoma changes in mice after ICH, assessed by 11.7T Ultrahigh field magnetic resonance on the 1, 3 and 7 days after ICH. n = 3 for Sham; n = 4 for ICH and Vehicle, n = 4 for ICH and FK228. (D, F) Coronal T2* mapping images of radiological content of Iron in mice after ICH, assessed by 11.7T Ultrahigh field magnetic resonance on the 1, 3 and 7 days post‐ICH. n = 3 for Sham; n = 4 for ICH and Vehicle, n = 4 for ICH and FK228. (G) Fault foot, Rotarod and Wire hanging test for mice for up to 28 days after ICH in vivo, n = 7 for Sham; n = 14 for ICH and Vehicle, n = 15 for ICH and FK228 for Rotarod and Fault foot test; n = 7 for Sham; n = 9 for ICH and Vehicle, n = 9 for ICH and FK228 for Wire hanging test. All the data are presented as the mean ± SD. One‐way ANOVA test and Bonferroni post hoc (B), Two‐way ANOVA repeated measurement (E–G). **p < 0.01, ***p < 0.001, ns: no significance.
