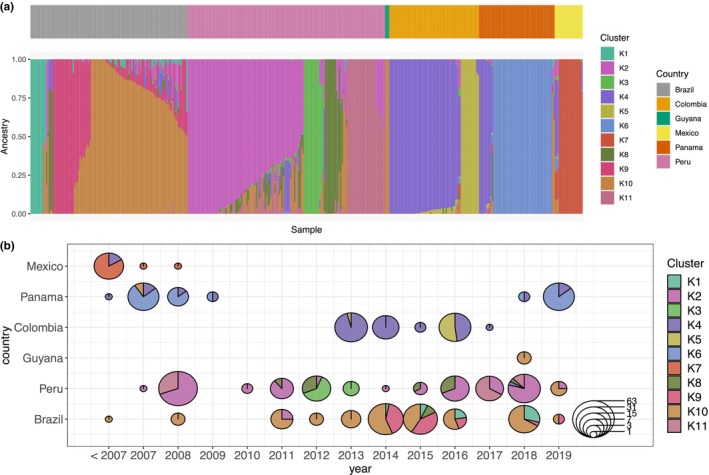
FIGURE 3.

Spatio‐temporal population dynamics in Latin America. Admixture analysis of Plasmodium vivax samples from LAM, using K = 11 populations. (a) Bar plot with admixture proportions of each sample for each ancestry cluster, with in the small bar on top the country of origin for each sample. (b) Each sample is assigned to one ancestry cluster based on the highest membership probability to that population in the admixture analysis. Pie charts represent the number of samples from each cluster in that country and year.
