FIGURE 6.

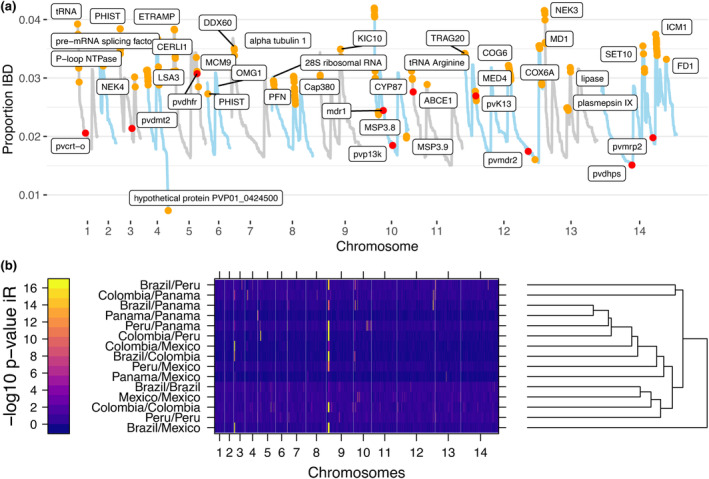
Pairwise IBD between isolates across the five populations in LAM. (a) Line plot of median IBD shared between pairs of Plasmodium vivax samples along the chromosomes. IBD segments with highly significant IBD are indicated in orange and annotated genes of interest at peaks of IBD‐sharing are labeled. The top genes that share significant IBD in the populations are listed in Table S2. Labeled dots in red indicate the positions and level of IBD sharing of putative drug resistant associated genes (list from Kattenberg et al., 2022). (b) Heatmap of significant pairwise IBD between populations in LAM are clustered on rows for similar patterns between populations. Low to high −log10 p‐values indicating significance levels of IBD sharing are color graded from blue to yellow. Significant IBD‐sharing is seen at a −log10 p > 1.3 (i.e., p < .05), and a threshold of −log10 p > 10 was used to identify highly significant areas of IBD‐sharing.
