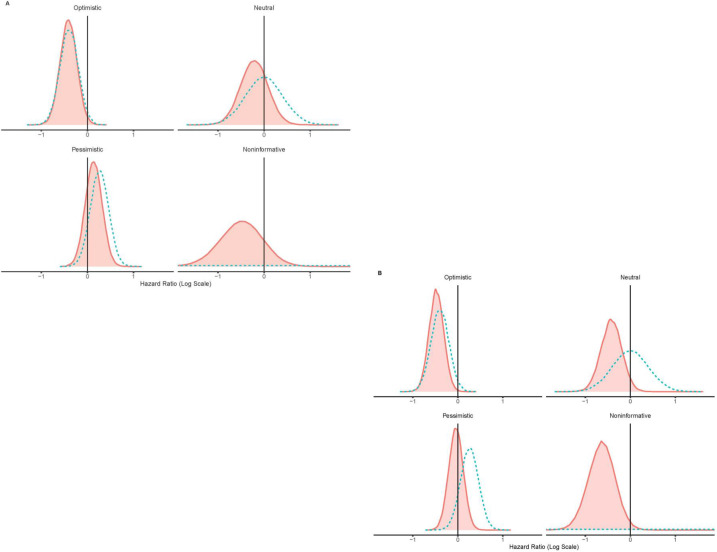
Figure 3.
Post hoc Bayesian analysisa of the phase 3 INCREASE trial: prior and posterior distributions for time to first disease progression. Distributions for PVR four (A) and PVR five (B). aPink solid distributions represent the posterior distributions of log HR, and the blue dashed lines represent the prior distributions. For optimistic, neutral and pessimistic prior distribution of log HR, normal distributions were used with the following parameters: optimistic (mean (SD)): 0.4 (0.2); neutral (mean (SD)): 0 (0.4); pessimistic (mean (SD)): 0.262 (0.2). For non-informative prior, uniform distribution was used. PVR, pulmonary vascular resistance.

