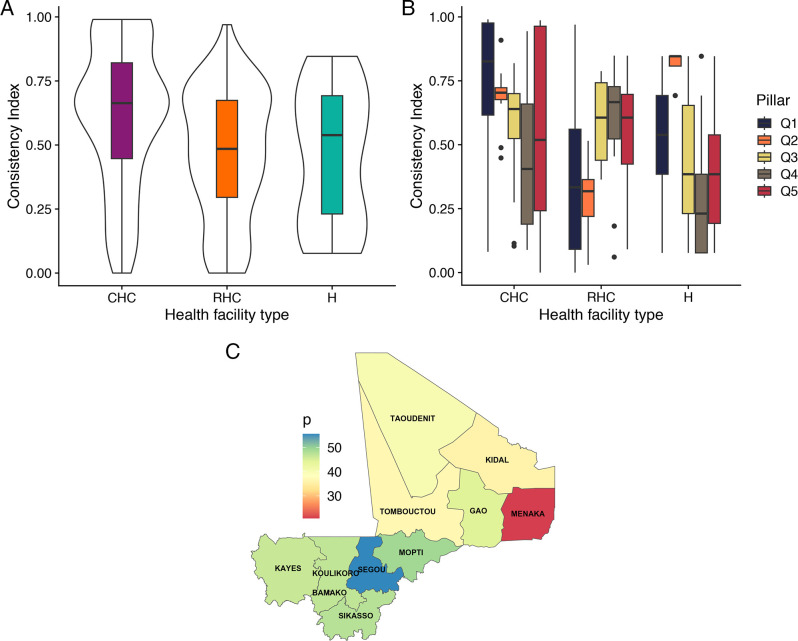
Figure 2.
Violin and box plots of the Consistency Index (CI) values for each health facility type, based on service availability and map indicating service availability at the regional level in Mali. (A) The violin plots show the distribution of the CI values taking into account all the essential health services, and the box plots show the median (horizontal line) and the IQR (box outline). The whiskers extend from the hinge to the highest and lowest values that are within 1.5 IQR of the hinge. (B) CI values for each health facility type and essential health service pillar, based on service availability. Q1, general clinical and emergency care services; Q2, child health and nutrition; Q3, communicable diseases; Q4, sexual and reproductive health; Q5, non-communicable diseases. (C) The mean probability by region for an essential health service to be available at a community health centre. CHC, community health centre; H, hospital; RHC, reference health centre.

