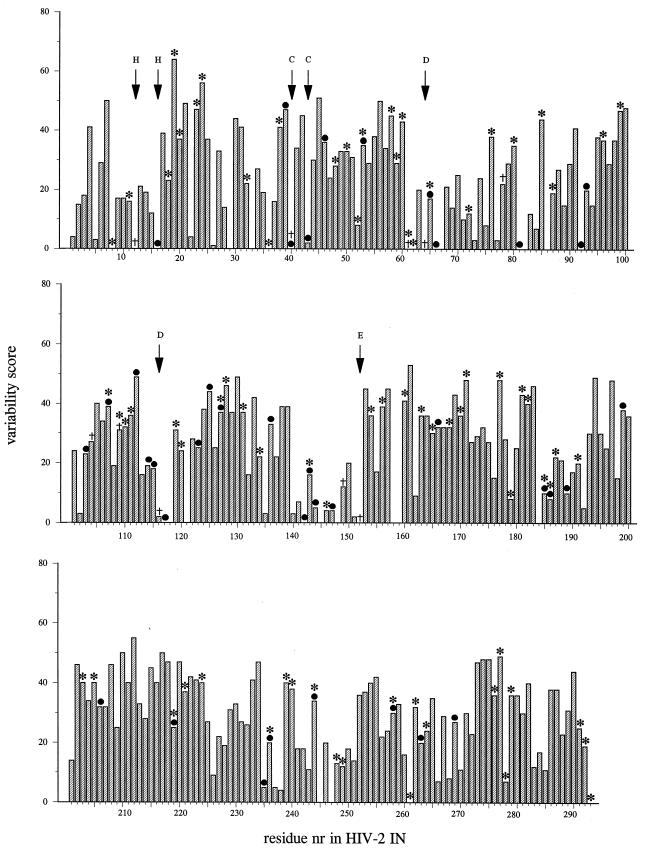
FIG. 1.
Histogram representation of relative entropies of variability for all amino acids of HIV-2 IN. Percent variability (y axis) is plotted against residue number (nr) of HIV-2 IN (x axis). Relative entropies were derived from homology-derived structure prediction by use of the PHD server (37). A small relative entropy indicates a high degree of sequence homology. Asterisks and bullets indicate residue which can be substituted in HIV-2 IN without a loss of in vitro IN activity, as determined in this study (including single and multiple mutants) and as reported in the literature (11, 15, 17, 19, 28, 35, 45), respectively. Daggers indicate residues for which substitution results in a protein with <10% wild-type activity. Letters above the arrows indicate highly conserved residues.

