
Figure 1.
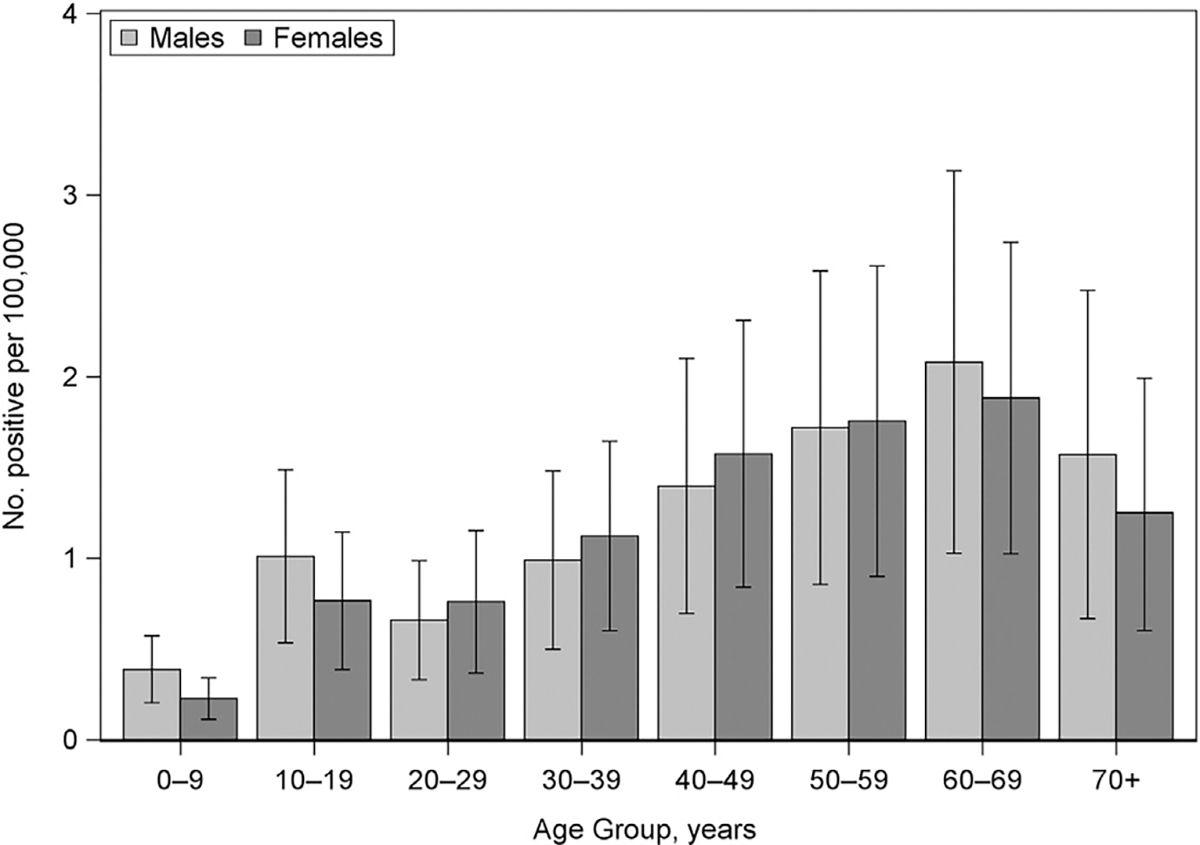
Number of persons who received positive test results per 100,000 population by age group and sex—United States, 2010 to 2018 (N = 33,999). Number of persons receiving positive test results per 100,000 was calculated using the average US Census population by age and sex during the study period. Mean estimates for each age group among males and females are represented by the clustered bars with 95% confidence intervals included for each mean estimate. No., number.