
Figure 3.
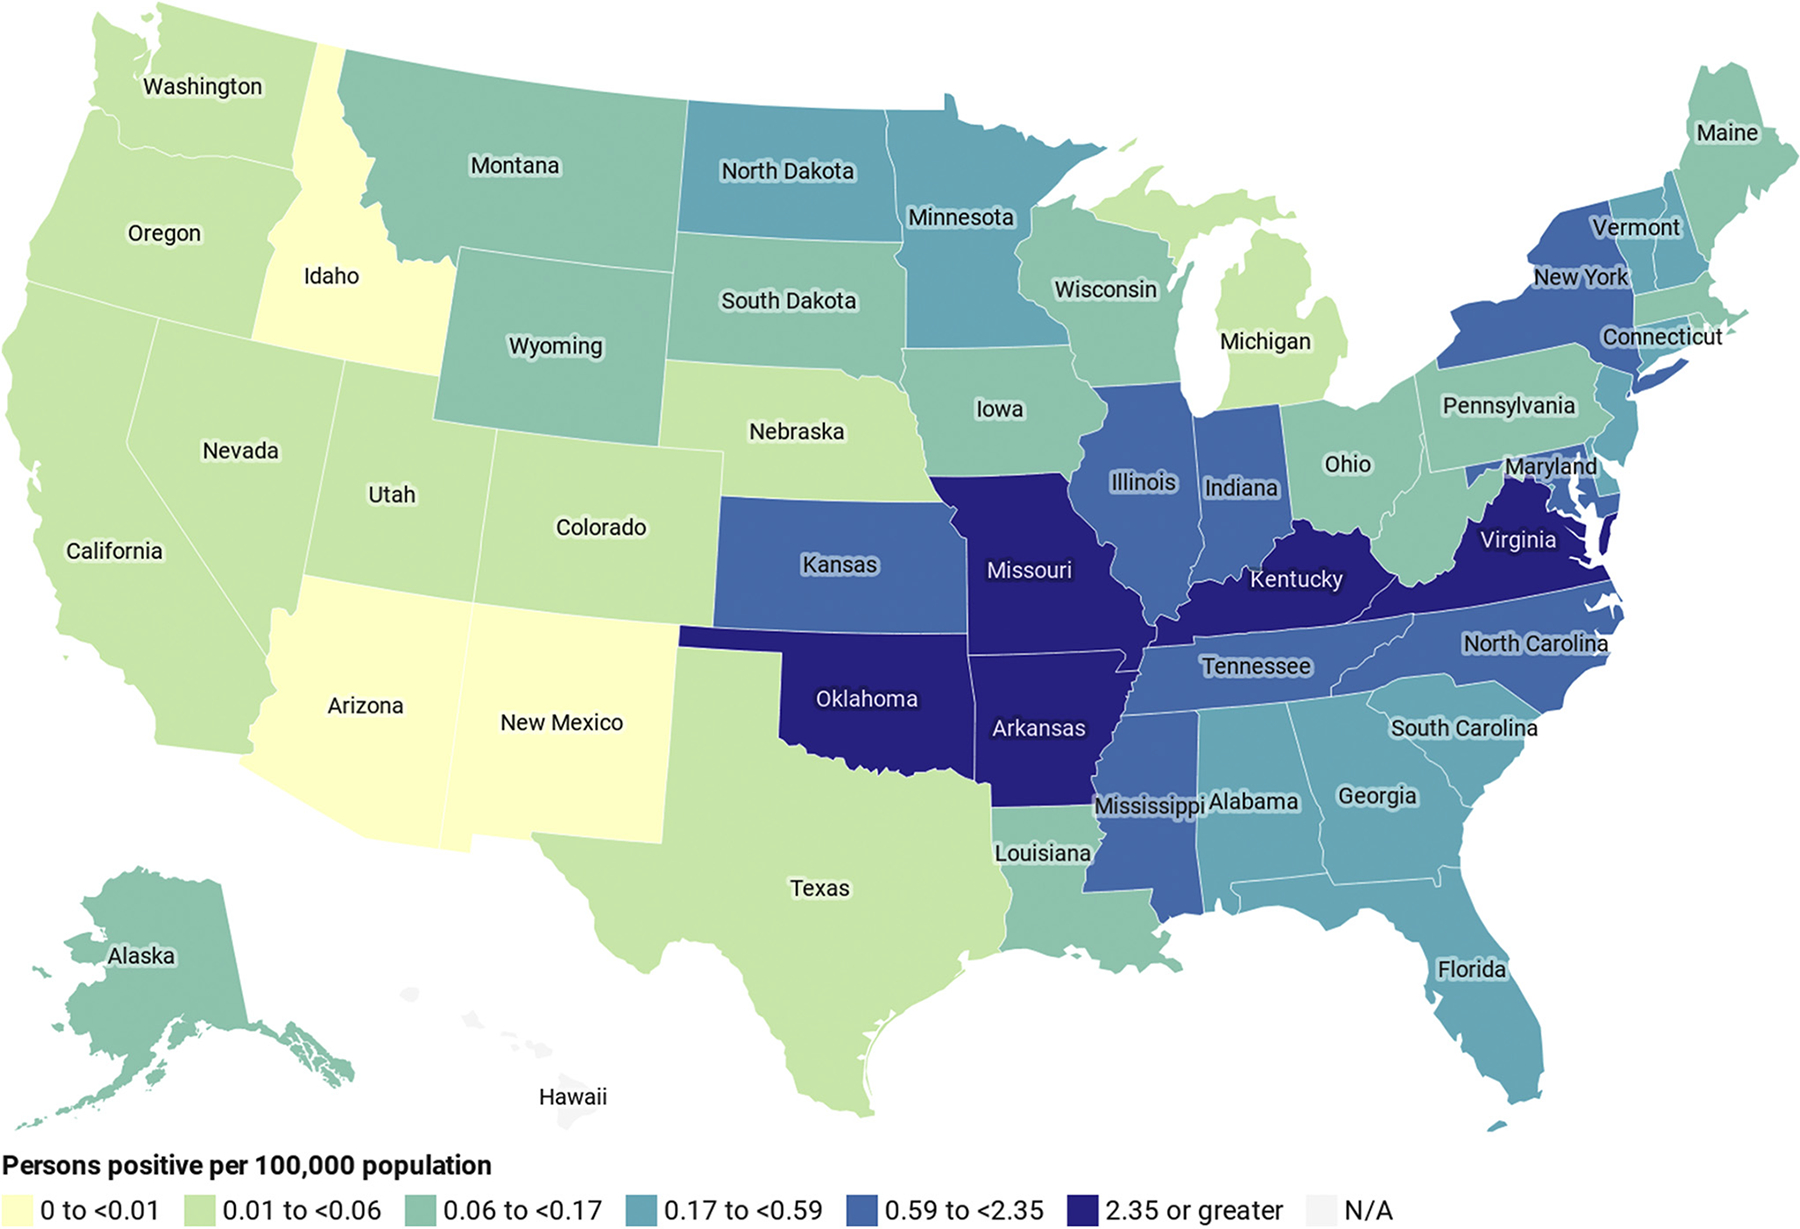
Geographic distribution of alpha-gal IgE-positive persons per 100,000 population by state—United States, 2010 to 2018 (N = 15,091). Data are based on the state of origin of the first specimen testing positive for 15,091 persons. Number of persons tested and number of positive per 100,000 were calculated using the average US Census population by state during the study period. Legend categories were created using percentile distribution of data. Alpha-gal, galactose-alpha-1,3-galactose; IgE, immunoglobulin E; N/A, not applicable; No., number.