
FIGURE 3.
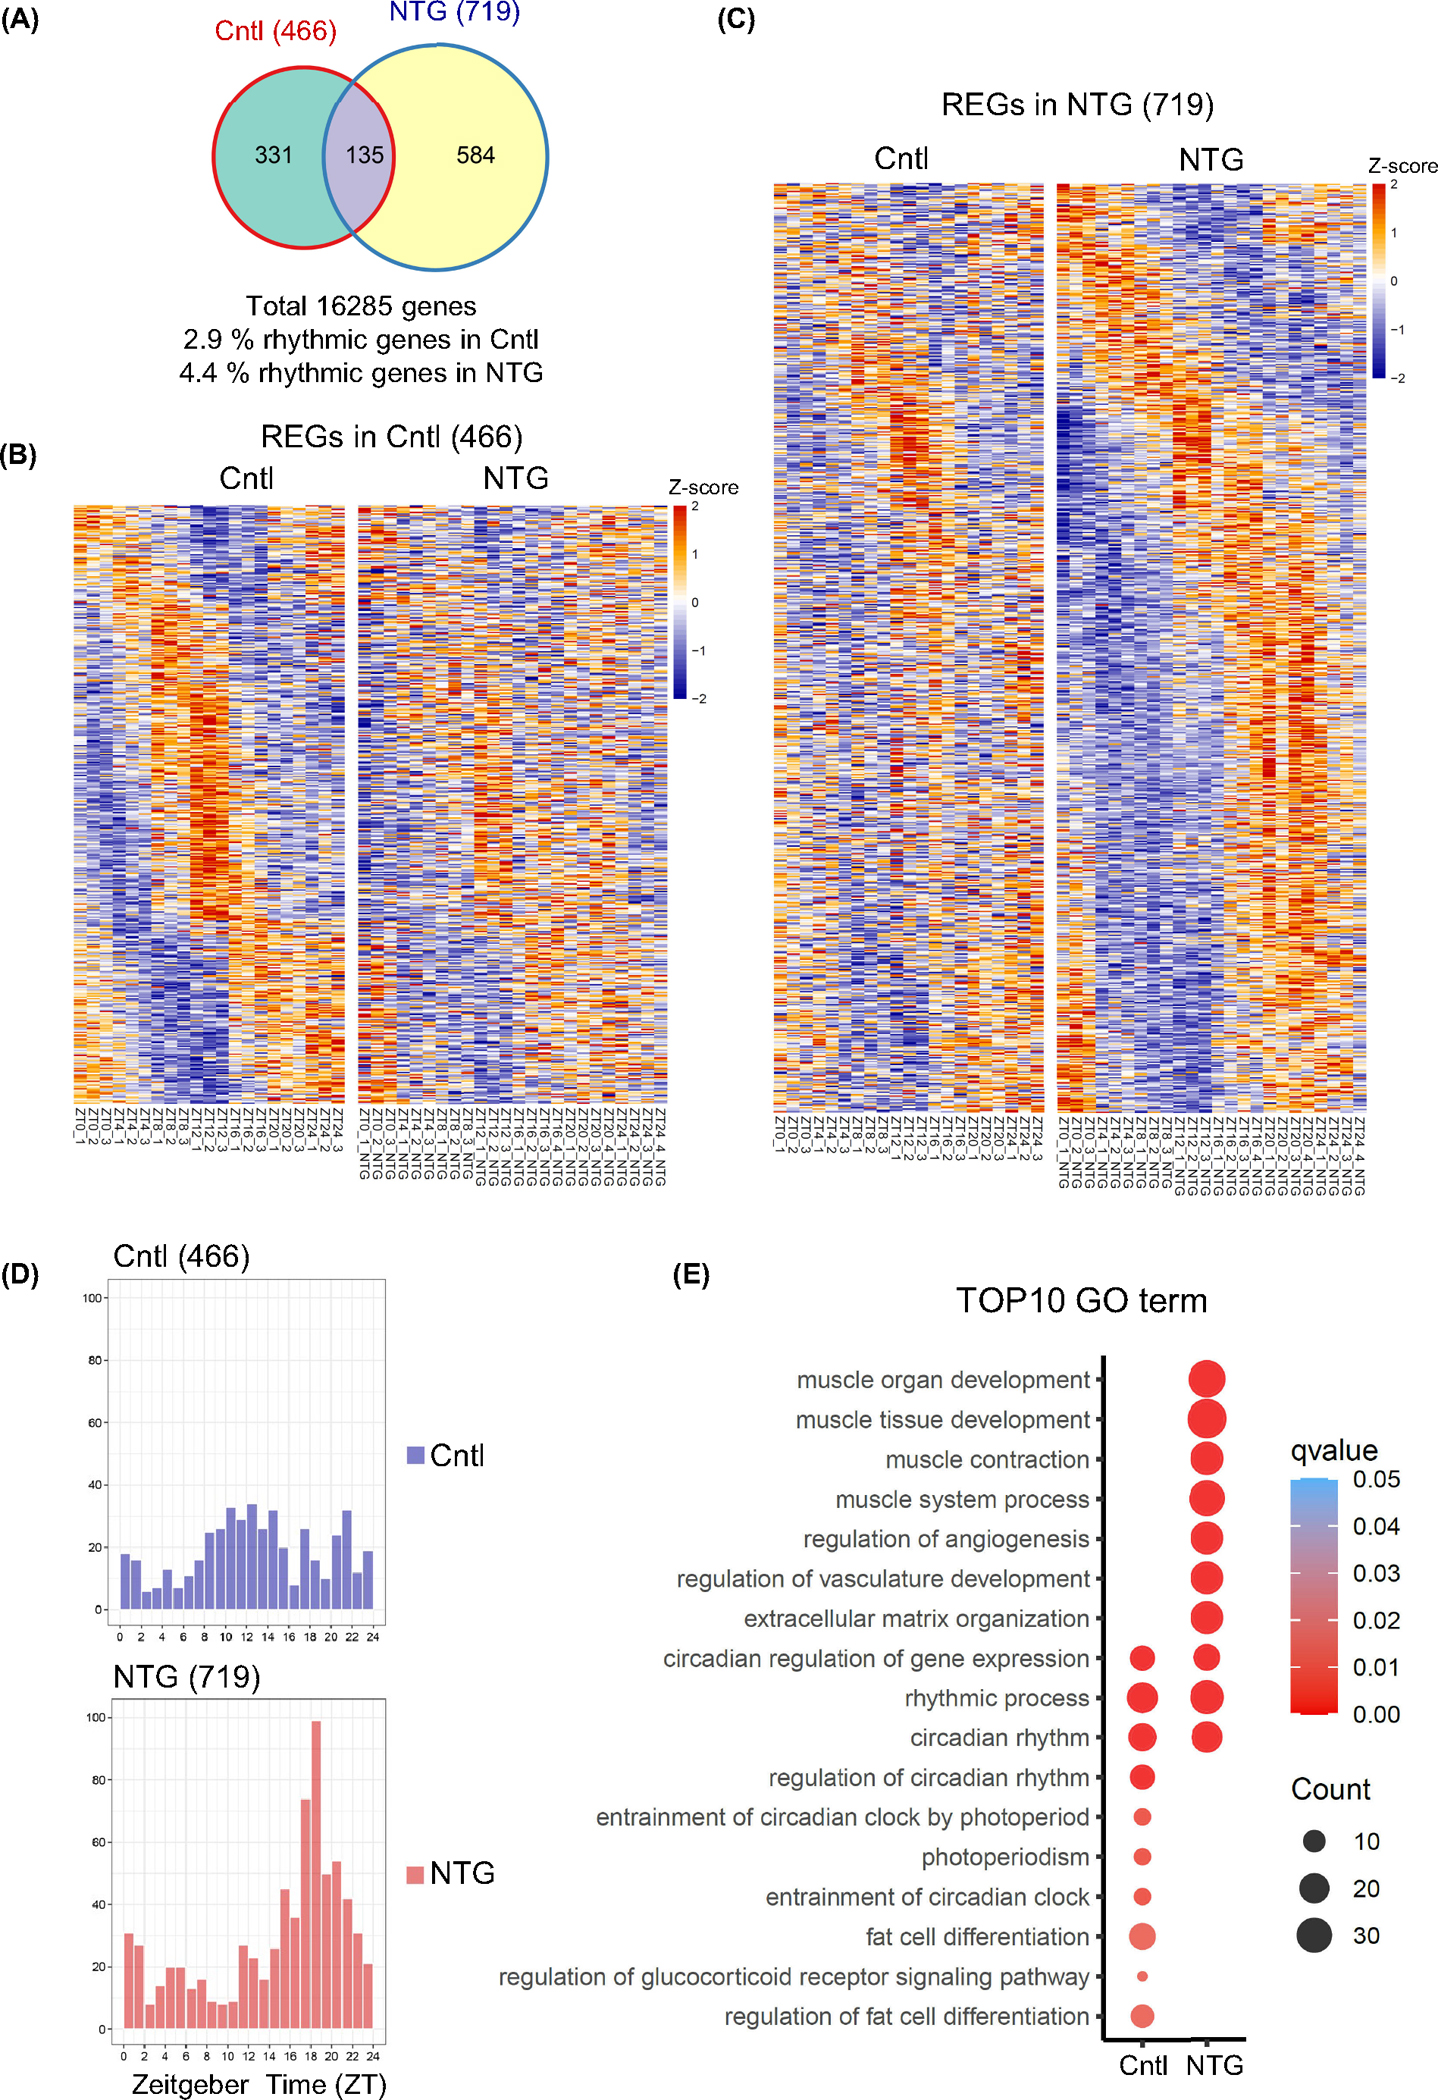
Robust circadian transcriptome in trigeminal ganglion (TG) and reprogramming of transcriptomic landscape by nitroglycerin (NTG)-induced chronic pain model. (A) Venn diagrams of rhythmically expressed genes (REGs) in the control and NTG groups. (B) Heatmap view of control REGs (466) in control (Cntl) and NTG groups. (C) Heatmap view of NTG REGs (719) in Cntl and NTG groups. Each gene is represented as a horizontal line, ordered vertically by phase determined by MetaCycle. (D) Histograms showing peak phase distributions of REGs in Cntl and NTG-treated groups. The control group showed a unimodal distribution of REG at ZT14, while the NTG group shifted to ZT18 (Rayleigh test, p < 0.05 and Watson’s U2 test, p < 0.05). (E) Top10 enriched gene ontology (GO) terms for REGs in control and NTG groups. Color gradient ranging from red to blue corresponds to the order of increasing q-value, and the size of the bubbles indicates the gene count of each GO term.