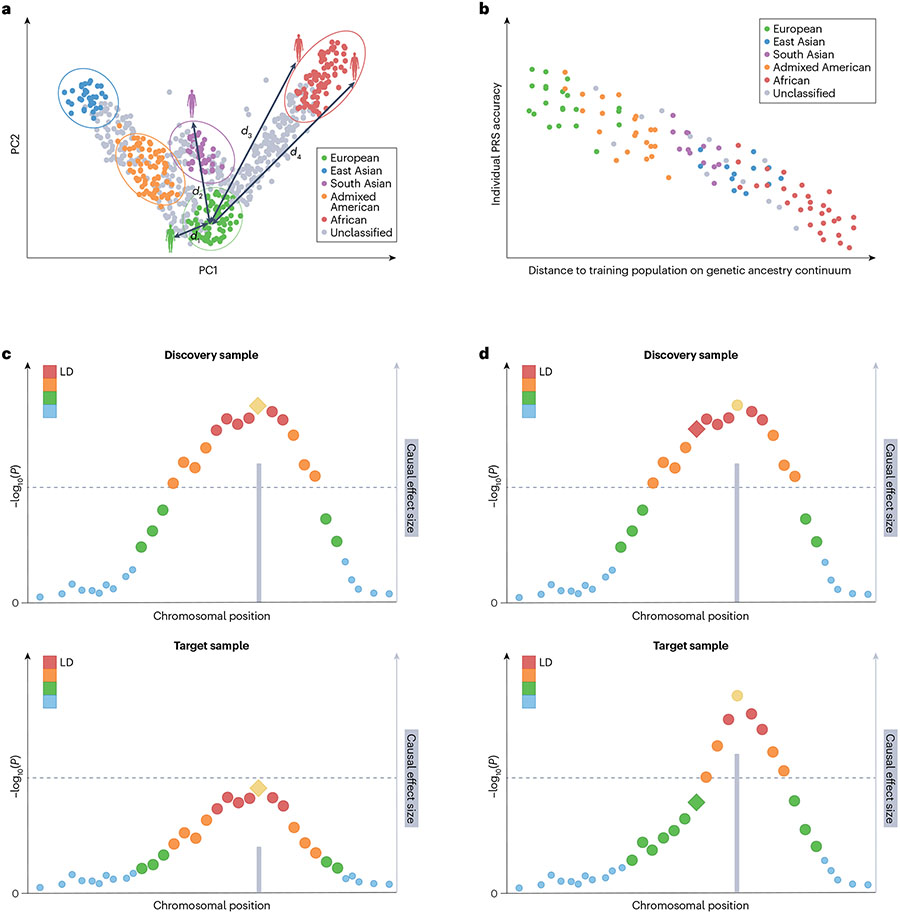
Fig. 2 ∣. Genetic factors that can influence PRS performance.
a, First two principal components (PCs) of the genetic data. Each dot represents an individual. Individuals are assigned discrete population labels by applying arbitrary cut-offs to the genetic ancestry continuum. Different colours represent different population labels. Grey dots represent individuals who are unclassified. A genetic distance (d) can be calculated between each individual and the centre of the discovery genome-wide association study (GWAS) samples in the PC space. b, Prediction accuracy of the polygenic risk score (PRS) shows individual to individual variation and decreases along the genetic ancestry continuum when the genetic distance between the training and target samples increases. c, Differences in causal allelic effect size between the discovery (upper graph) and target (lower graph) samples can influence the accuracy of PRS across populations. d, Differences in linkage disequilibrium (LD) patterns between the discovery (upper graph) and target (lower graph) samples can influence the accuracy of PRS across populations. In panels c and d, each dot represents the marginal association strength of a genetic variant. The lead (most associated) variant in yellow represents the causal variant and the grey bar represents its effect size. Other variants are coloured by descending degrees of LD with the causal variant (ordered red, orange, green and blue dots). Diamond represents the variant (which may be a tagging variant) used in PRS construction. Dashed line represents genome-wide significance.

