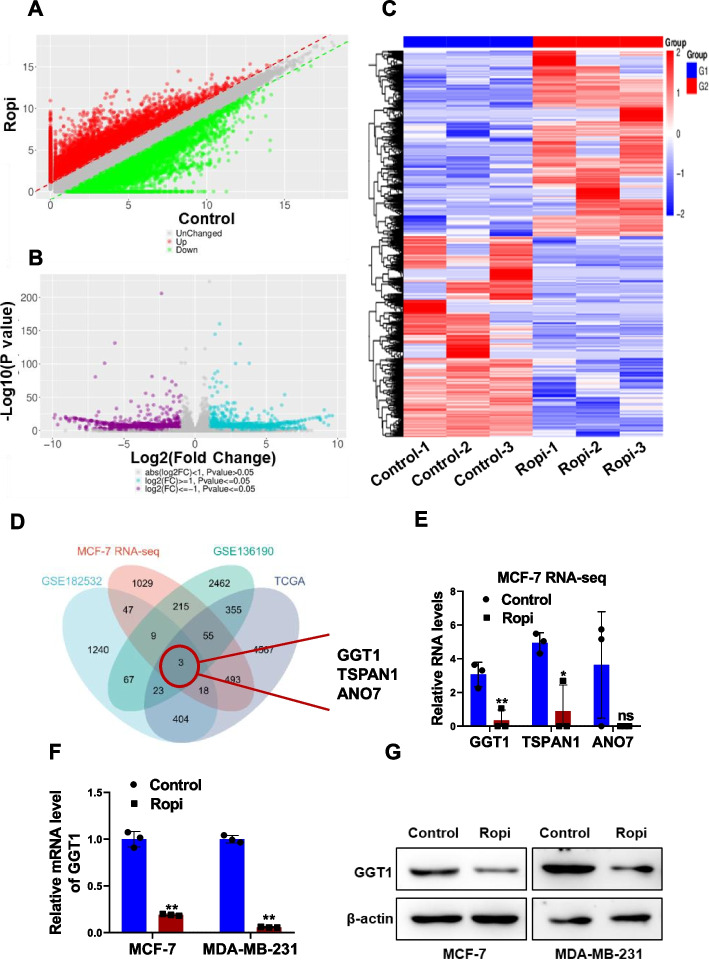
Fig. 3.
Identification of GGT1 as a ropivacaine-responding gene in breast cancer cells. A-B RNA-seq data of ropivacaine- or negative control-treated MCF-7 cells. The scatter plot (A) and volcano map (B) showing differentially-expressed genes. C Heatmap representing the top 50 up-regulated and down-regulated genes in MCF-7 cells treated with ropivacaine or negative control. D The intersection among four databases. E RNA levels of GGT1, TSPAN1 and ANO7 in MCF-7 cells treated with ropivacaine or negative control from RNA-seq data. F-G RNA (F) and protein (G) level of GGT1 in MCF-7 and MDA-MB-231 treated with ropivacaine (10 μM) or negative control for 48 h were was determined by qRT-PCR and western blot, respectively. Results are shown are shown as mean ± S.D from at least three independent experiments. *p < 0.05; **p < 0.01; ***p < 0.001 (unpaired two-tailed Student’s t test)

