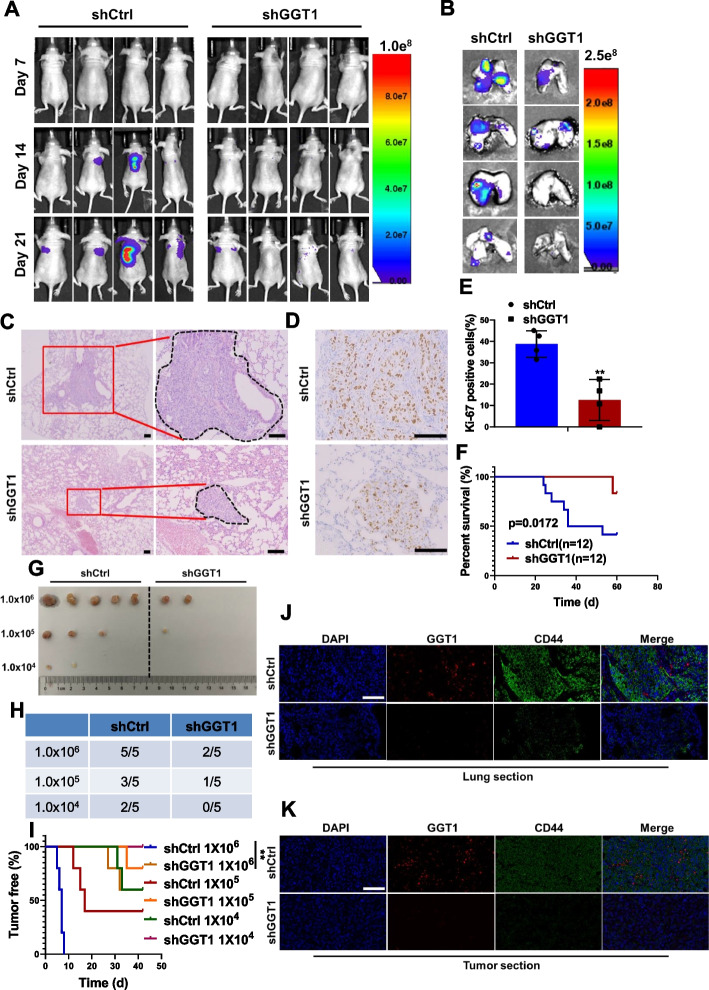
Fig. 8.
Effects of GGT1 on CSC-like phenotypes of breast cancer cells in vivo. A Bioluminescence images of the metastatic burden of mice at the indicated days after injection with MDA-MB-231-shCtrl or -shGGT1 cells intravenously (n = 4). B-C Bioluminescence images (B) and H&E staining (C) of lungs from mice intravenously injected with MDA-MB-231-shCtrl or -shGGT1 cells (scale bar = 100 μm) (n = 4). D-E Ki-67 staining of lung sections from mice intravenously injected with MDA-MB-231-shCtrl or -shGGT1 cells (scale bar = 100 μm) (n = 4). F Survival curve of mice intravenously injected with MDA-MB-231-shCtrl or -shGGT1 cells (n = 12). G-H The incidence of tumors in mice injected with different numbers of MDA-MB-231-shCtrl or -shGGT1 cells (n = 5). I The tumor-free survival curves of the mice that were inoculated with different numbers of MDA-MB-231-shCtrl or -shGGT1 cells (n = 5). J-K IF examination of GGT1 and CD44 expression in tumor sections from both lung tissues (J) and primary tumor tissues (K) derived from MDA-MB-231-shCtrl or -shGGT1 cells (scale bar = 100 μm) (n = 4).*p < 0.05; **p < 0.01; ***p < 0.001 (log-rank test in F and I, others unpaired two-tailed Student’s t test)

