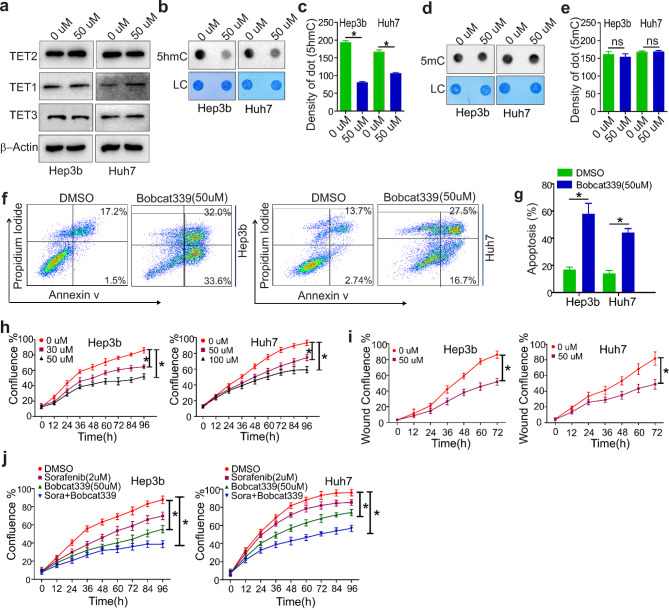
Fig. 6.
TET2 inhibitor Bobcat339 impairs resistant cell growth. a-e, SorafenibR Hep3b and Huh7 cells were treated with 50 µM TET2 inhibitor Bobcat339 for 72 h. (a), Western blot measuring protein expression of TET2, TET1 and TET3. Data represents three independent experiments. b and c, Dotblotting showing the changes of 5hmC amount (b). The graphs (c) are the quantification of dot intensity as mean values ± S.D. from three independent experiments. d and e, Dotblotting to assess changes in 5mC amount (d). The graphs (e) are the quantification of dot intensity as mean values ± S.D. from three independent experiments. f and g, Flow cytometry showing cell apoptosis (f). Graphs (g) are quantification of cell apoptosis (%) as mean values ± S.D. from three independent experiments. h and i, Proliferation (h) and migration (i) assays. Data represents two independent experiments with 12 repeats in total. (j), SorafenibR Hep3b and Huh7 cells were treated with either 50 µM Bobcat339 alone or plus 2 µM sorafenib for 72 h. Cell proliferation assays were used to determine drug response. Data represents two independent experiments with 12 repeats in total. *P < 0.05; LC, loading control

