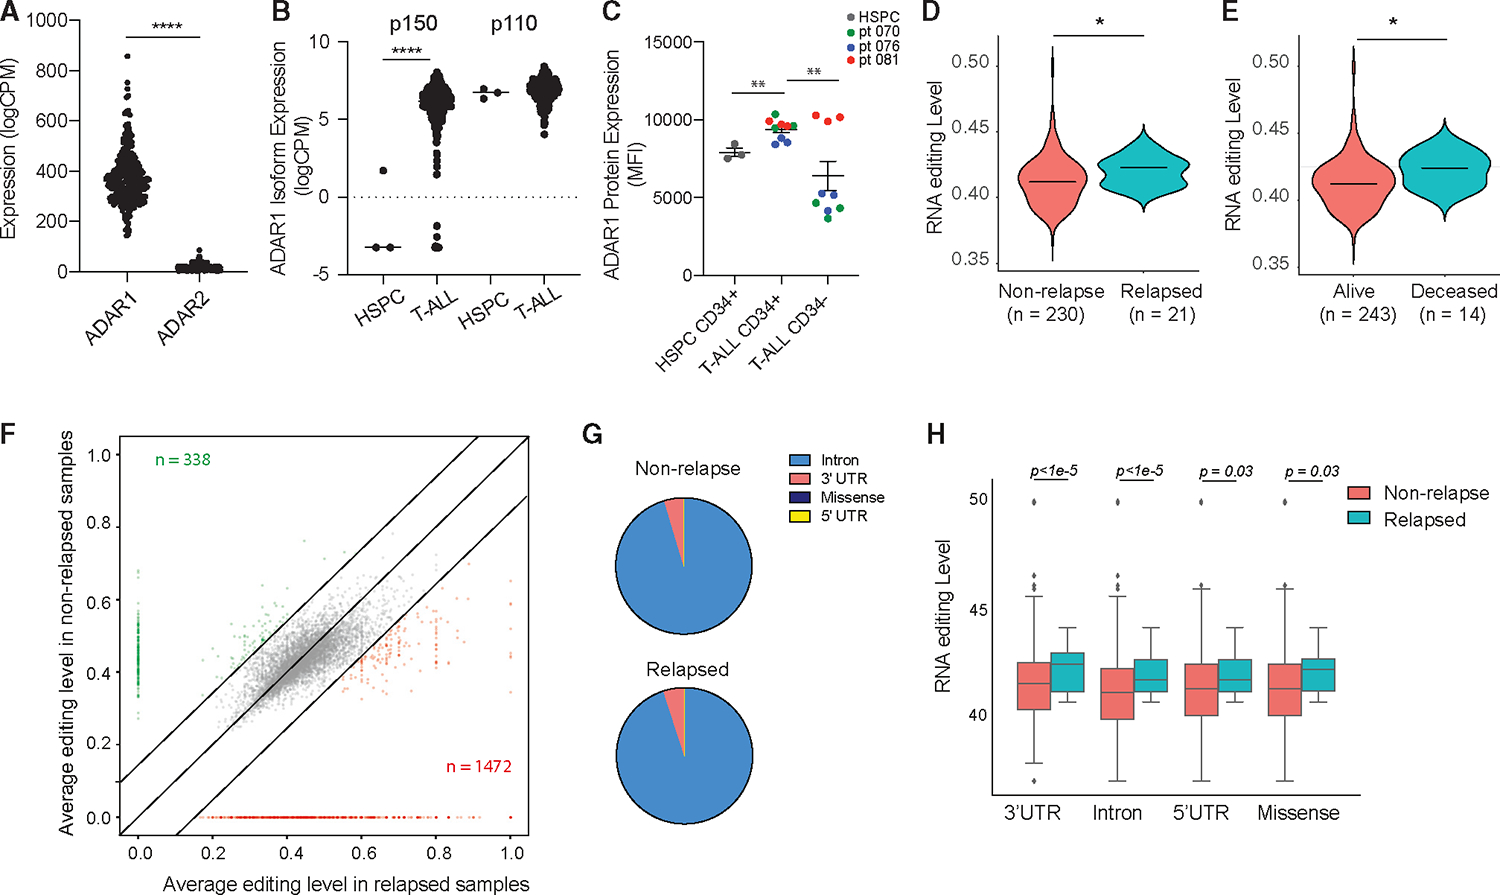
Figure 1. Relapsed T-ALL acquires a distinct RNA editome in contrast to non-relapsed T-ALL.

(A) Expression of ADAR1 and ADAR2 in T-ALL patient by RNA sequencing (n = 256).
(B) Isoform expression of ADAR1 p150 and p110 between HSPCs (n = 3) and T-ALL (n = 256).
(C) Quantification of ADAR1 expression in cord blood HSPCs (CD34+Lin−), T-ALL LICs (CD34+Lin−), and non-LICs (CD34−Lin+). n = 3 cord blood HSPC and 3 T-ALL samples.
(D and E) Overall RNA editing between relapsed and non-relapsed patients (D) or between mortality status (E) in violin plots.
(F) Comparison of RNA-editing level between relapsed and non-relapsed cohort display under-edited sites (green) and overedited sites (red) with editinglevels >0.2 and detected in >10% of patients in each group.
(G) Pie chart showing RNA-editing locations in non-relapsed and relapsed T-ALL.
(H) Elevated RNA-editing levels across all categories of editing locations between non-relapsed (n = 230) and relapsed groups (n = 21).
Statistical analysis was calculated by unpaired Student’s t test.
