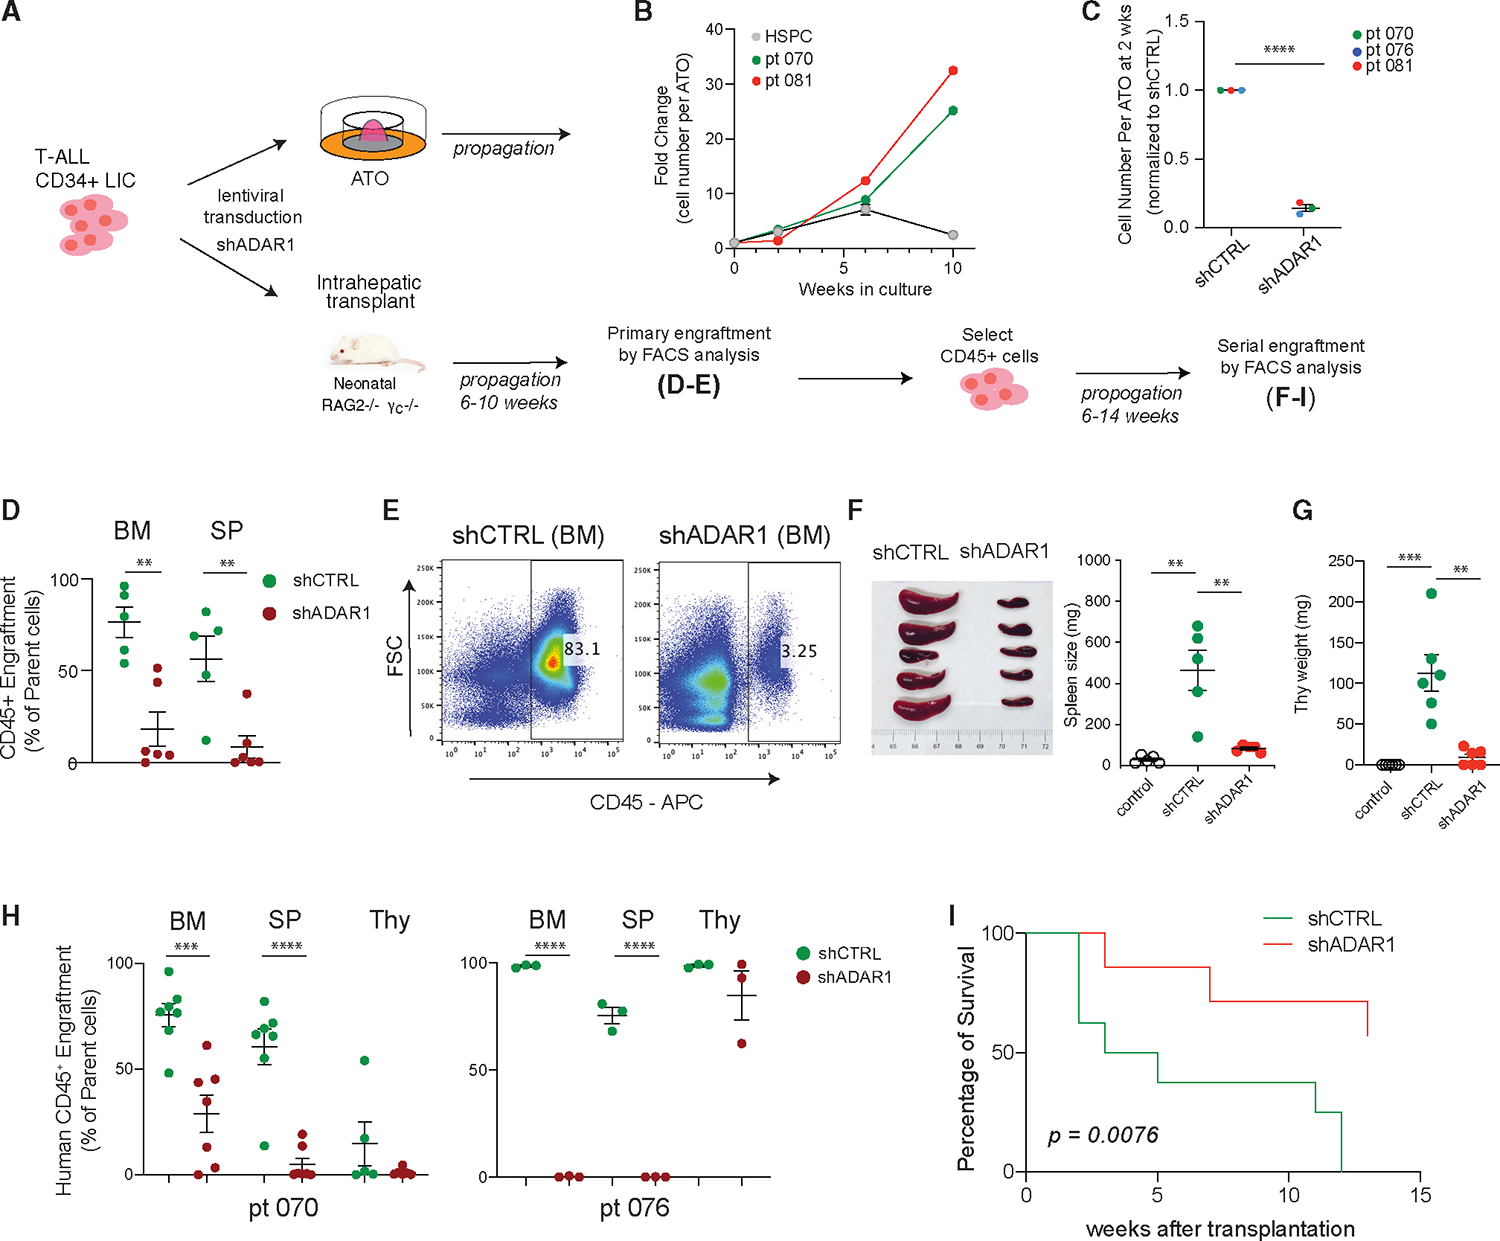
Figure 2. Loss of ADAR1 impairs T-ALL LIC functions.

(A) Experimental setup for assessing ADAR1’s effects on T-ALL propagation in ATO and PDX models.
(B) Growth curve of T-ALL samples (n = 2, patient 081 and patient 076) in ATO co-culture system. Cord blood CD34+ HSPCs (n = 2) are also shown. Error bars represent mean with SEM.
(C) Human CD45+ cells were quantified by flow cytometry in non-targeting lentiviral control (shCTRL [shRNA control]) or shADAR1 conditions (n = 3 T-ALL samples).
(D and E) Effects of ADAR1 knockdown on primary transplant of LICs (n = 5 mice for shCTRL and n = 6 mice for shADAR1). An example of flow cytometry showing human CD45+ engraftment in bone marrow is shown in (E).
(F–I) Serial transplant assay of shCTRL and shADAR1.
(F–G) The weights of spleen (F) (n = 5 mice per group) and thymus (G) (n = 6 mice per group) were measured after serial transplant.
(H) Human CD45+ frequencies in the bone marrow, spleen, and thymus of two T-ALL PDX models (n = 3–7 mice per group).
(I) Loss of ADAR1 is associated with improved mouse survival (patient 076, n = 7–8 mice per group). p value was determined by the Mantel-Cox log-rank test.
(C–H) Error bars represent mean with SEM. *p < 0.05, **p < 0.01, ***p < 0.001, and ****p < 0.0001, unpaired Student’s t test.
