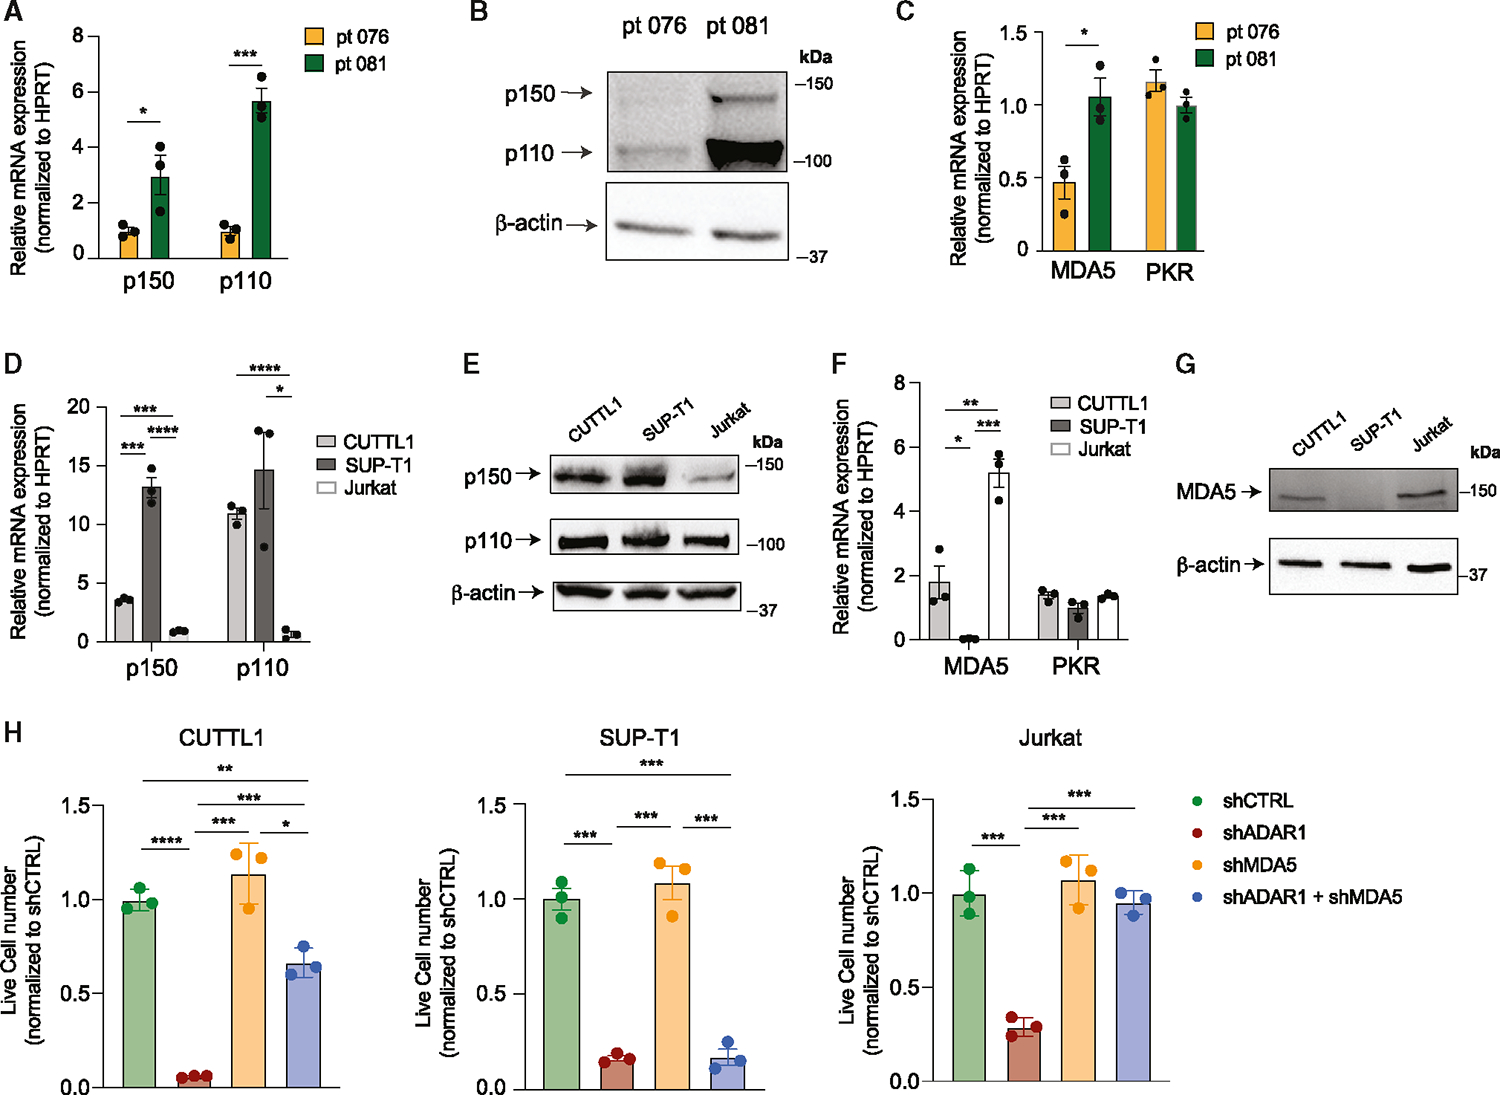
Figure 5. Basal expression of MDA5 controls dependency on the ADAR1-MDA5 axis.

(A and B) Expression of ADAR1 isoforms in patient 076 and patient 081 was measured by RT-qPCR and western blot in Lin−CD34+ LIC-enriched population (n = 3 independent experiments).
(C) Expression of MDA5 was determined in Lin−CD34+ LIC-enriched cells of patient 076 and patient 081 (n = 3 independent experiments).
(D and E) Expression of ADAR1 isoforms in three T-ALL cell lines, CUTTL1, SUP-T1, and Jurkat (n = 3 independent experiments).
(F and G) MDA5 and PKR mRNA expression (F) and protein level (G) were determined in T-ALL cell lines (n = 3 independent experiments).
(H) Cell counts of shRNA control, shADAR1, shMDA5, and co-knockdown of shADAR1 and shMDA5 were assessed 3 days post-lentiviral transduction. Data from three independent experiments are shown.
Error bars represent mean with SEM. *p < 0.05, **p < 0.01, ***p < 0.001, and ****p < 0.0001, unpaired Student’s t test.
