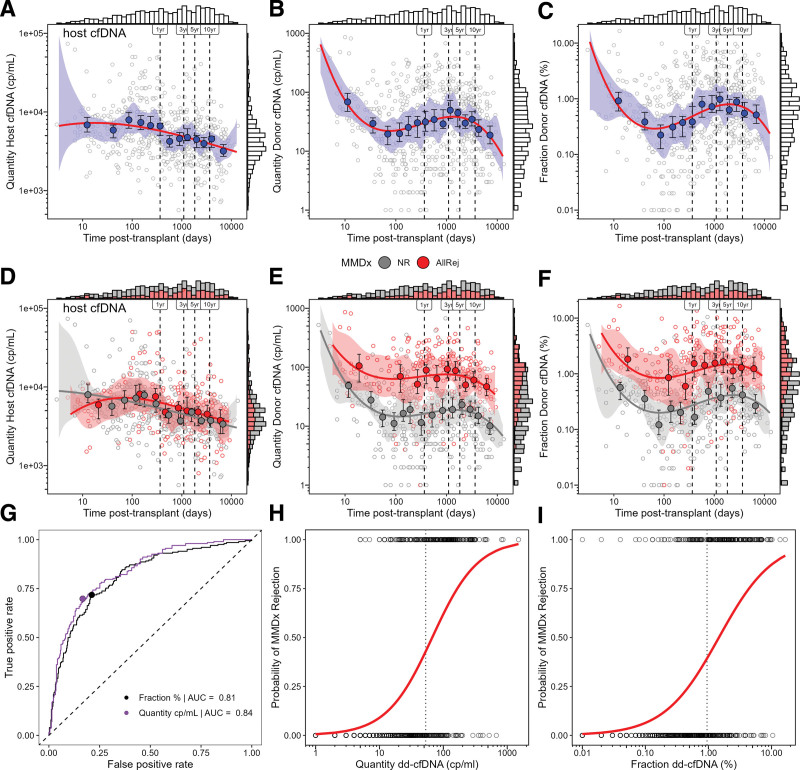
FIGURE 2.
Time series of estimated quantity of host cell-free DNA (cp/mL), dd-cfDNA (cp/mL), and fraction dd-cfDNA (%) following transplant (A–F). Temporal patterns were estimated using binscatter regression. Shaded blue, gray, and red bands represent the confidence bands estimated by the binscatter method (A–C). Open circles represent individual biopsies and closed blue, gray, and red circles represent the conditional means dd-cfDNA for each bin and their confidence intervals (A–F). Solid lines represent the predicted dd-cfDNA (A–F). Bars at the top and right margins of the plots represent stacked histograms of the distribution biopsies according to estimated plasma cfDNA and time posttransplant (A–F). Performance of dd-cfDNA in predicting MMDx all-rejection was assessed by ROC curves with diagonal dashed lines representing the 1:1 ratio of sensitivity and specificity (G). The probability of rejection was modeled by logistic regression predicting MMDx all-rejection with open circles represent individual biopsies and solid lines representing the probability of MMDx rejection predicted by logistic regression (H and I). Vertical dashed lines represent defined time points (ie, 1, 3, 5, and 10 y; A–F), and the optimal cutoffs (H and I). dd-cfDNA, donor-derived cell-free DNA; MMDx, Molecular Microscope Diagnostic System.

