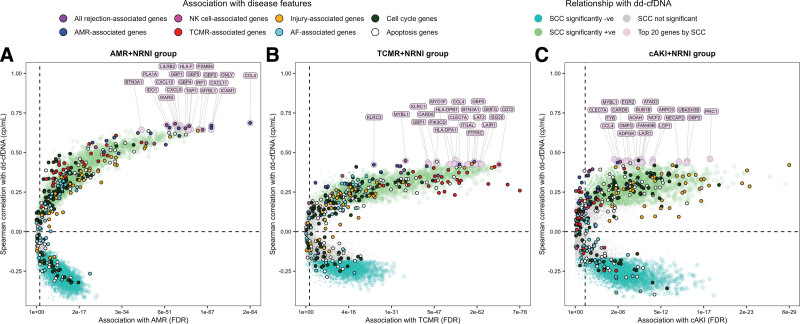
FIGURE 4.
Differential expression and correlation genescape demonstrating gradients in gene associations with dd-cfDNA by MMDx subgroups. Biopsies called AMR (A), TCMR (B), and cAKI (C) were pooled with biopsies called NRNI in attempt to isolate the gradient moving from low intensity to high intensity for each disease state. Differential expression is represented FDR in FC in AMR, TCMR, and cAKI vs NRNI. Correlations are expressed as SCC of gene expression with dd-cfDNA within each grouping. Individual genes are represented as colored circles. Circles are first colored to show genes with significantly positive SCCs (green), significantly negative SCCs (turquoise), and nonsignificant SCCs (gray). Circles/genes are then colored by their annotation with major disease phenotypes as described in the Supplemental Material (SDC, http://links.lww.com/TP/C935). Finally, the top 20 genes by SCC are labeled and colored (mauve). AF, atrophy-fibrosis; AMR, antibody–mediated rejection; cAKI, clinical acute kidney injury; dd-cfDNA, donor-derived cell-free DNA; FC, fold change; FDR, false discovery rate; MMDx, Molecular Microscope Diagnostic System; NK, natural killer; NRNI, MMDx Normal and archetypal No injury; SCC, Spearman correlation coefficients; TCMR, T cell–mediated rejection.

