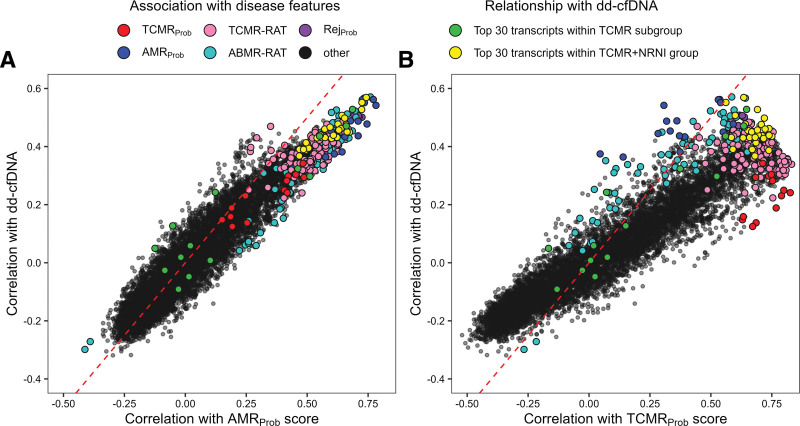
FIGURE 5.
Spearman correlation gene expression with dd-cfDNA in IQR-filtered probesets compared with Spearman correlations with AMRProb (A) and TCMRProb (B) classifier scores. Individual probesets are represented as colored circles. Circles are first colored to show probesets with significantly positive SCCs (green), significantly negative SCCs (turquoise), and nonsignificant SCCs (gray). Circles/probesets are then colored by their gene annotation with major disease phenotypes as described in the Supplemental Material (SDC, http://links.lww.com/TP/C935). AMR, antibody–mediated rejection; dd-cfDNA, donor-derived cell-free DNA; IQR, interquartile range; SCC, Spearman correlation coefficients; TCMR, T cell–mediated rejection.

