Figure.
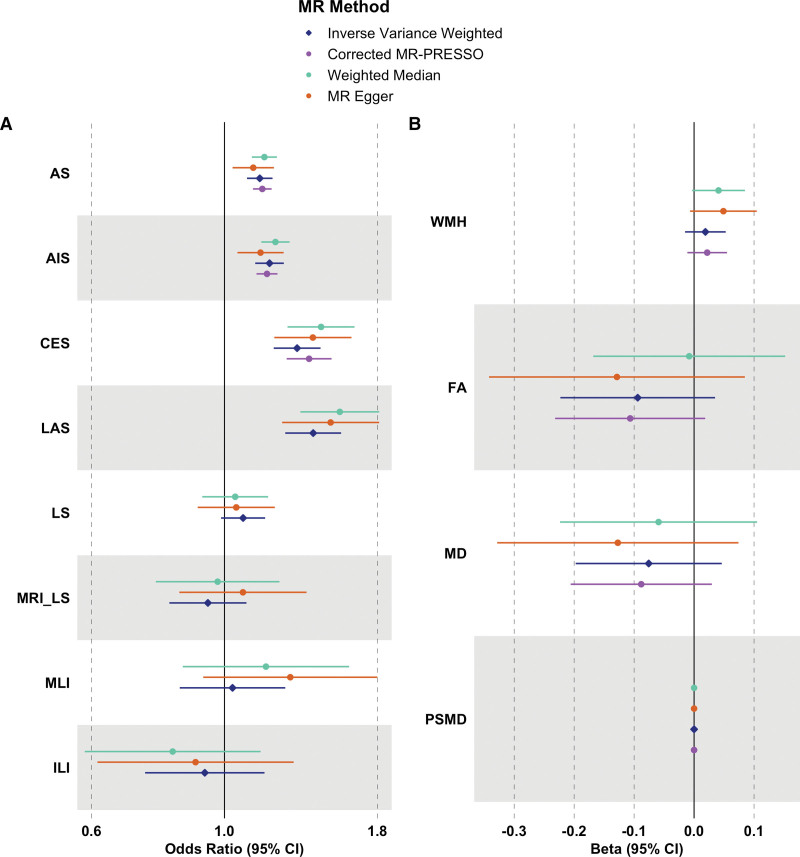
Forest plot. Forest plot of causal estimates and their 95% CIs between genetically predicted risk of (A) venous thrombosis and stroke and (B) imaging markers of cerebral small vessel disease (cSVD) using 2-sample Mendelian randomization (MR) methods. AIS indicates any ischemic stroke; AS, any stroke; CES, cardioembolic stroke; FA, fractional anisotropy; ILI, isolated lacunar infarct; LAS, large-artery stroke; LS, lacunar stroke; MD, mean diffusivity; MLI, multiple lacunar infarcts with leukoaraiosis; MRI_LS, magnetic resonance imaging–confirmed lacunar stroke; MR-PRESSO, Mendelian Randomization Pleiotropy Residual Sum and Outlier; PSMD, peak width of skeletonized mean diffusivity; and WMH, white matter hyperintensity.

