
Figure 4.
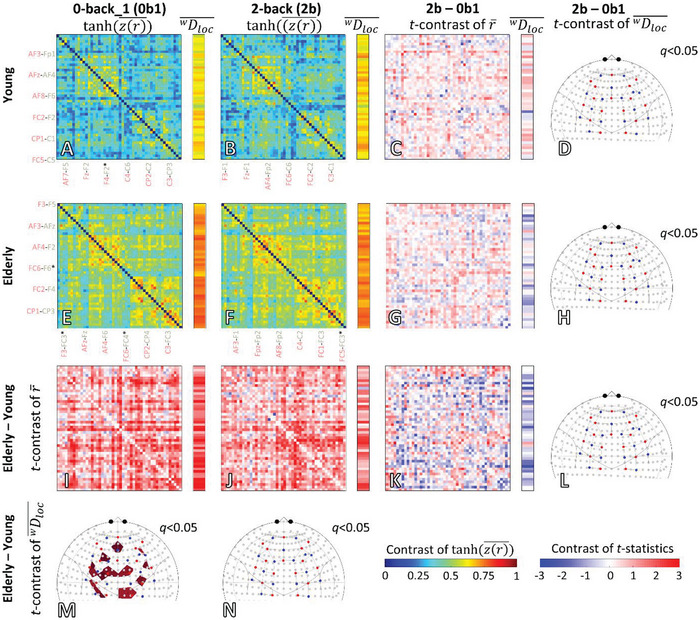
Statistical effect of age and task condition on local functional connectivity (FC) and local network metrics. Task effects are shown in rows; age effects are shown in columns. Color‐coded grand averages of Fisher z‐transformed Pearson‐adjacency matrices and network metrics are displayed for age groups and task conditions: A) young 0‐back_1, B) young 2‐back, E) elderly 0‐back_1 and F) elderly 2‐back. Each value in the average matrix represents the inverse Fisher‐transform—obtained by the atanh function—of the mean of Fisher‐transformed r, referring to an individual connection between the corresponding channels. The contrast between 0‐ and 2‐back conditions is displayed as a color‐coded matrix of t‐statistics obtained from pairwise comparisons in C) the young group (n = 21,) and in G) the elderly group (n = 30,). Similarly, the FC of the young and elderly groups were compared by calculating the statistical contrast (unpaired t‐statistics) between adjacency matrices for the 0‐back_1 (0b1) and 2‐back (2b) conditions. Statistical contrast maps obtained for I) 0b1 and J) 2b conditions indicate higher FC in the elderly group. In addition, a group‐ and task‐specific contrast was determined to assess the impact of aging on the channel‐wise connectivity response during 2b with respect to K) 0b1: [(elderly 2b—elderly 0b1)–(young 2b—young 0b1)]. For each pair of the channel, the mean weighted local node degrees (  ) are obtained as row‐wise averages of values representing connection strengths. Following a similar statistical approach for characterizing the age‐ and group‐specific changes, the t‐contrast of
  are also shown on the right to the corresponding color‐coded connection matrix. Finally, significance thresholded (q < 0.05, false discovery rate corrected) t‐contrasts of
  are mapped into the brain cortex for each statistical comparison: D) young 2b—young 0b1, H) elderly 2b—elderly 0b1, M) elderly 0b1—young 0b1, N) elderly 2b—young 2b, and L) [(elderly 2b—elderly 0b1)–(young 2b—young 0b1)]. Group‐ and task‐specific average adjacency matrices are color‐coded between 0 and 1; several channels are indicated below and to the left. Matrices and brain maps of statistical t‐contrasts are scaled in the [‐3 3] range.