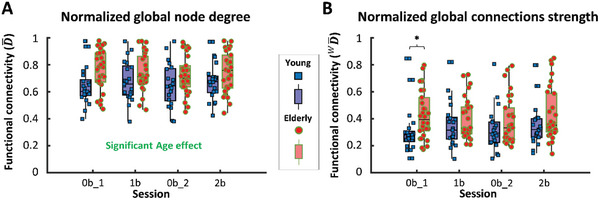
Figure 5.

Age‐related changes in global network metrics characterizing static functional connectivity (FC) in the frontal cortex during sessions of n‐back task. Individual global (i.e., referring to the whole frontal cortex) network metrics values are shown in blue squares (young group, n = 21) or red dots (elderly group, n = 30) separately for 0‐back_1 (0b1), 1‐back (1b), 0‐back_2 (0b2) and 2‐back (2b) sessions. Corresponding median values and interquartile ranges are displayed as purple (young group) or pink (elderly group) boxplots. A) Normalized global node degree ( ) is significantly higher in the elderly group throughout all task sessions, as indicated by GLM and confirmed by the Tukey post‐hoc test (p = 0.0282). B) Normalized global connection strength ( ) differs significantly only for 0b1 session as indicated by the Mann‐Whitney test (p = 0.006).
