
Figure 8.
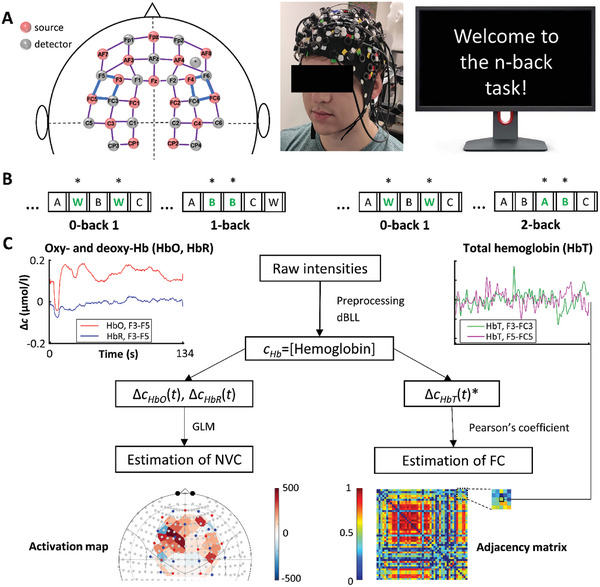
Schematic overview of measurement and analysis protocol for neurovascular coupling (NVC) and functional connectivity (FC) assessments. All results are based on data from 21 young and 30 aged participants. A) Cerebral hemodynamics were recorded from the frontal brain cortex using functional near‐infrared spectroscopy (fNIRS). The montage on the left shows the position of 16 light sources (pink) and 16 detectors (green) that define 48 measurement channels with 3 cm source‐detector separation shown as purple edges; blue edges denote the dorsolateral prefrontal cortex (DLPFC). The photo in the middle shows the fNIRS cap on the head of the participant and was set up according to the montage. Before the test, participants were seated in front of a computer that displayed instructions and administered the test. B) The cognitive stimuli were presented as part of a visual n‐back paradigm consisting of 0‐back, 1‐back, 0‐back and 2‐back sessions targeting the working memory domain. In brief, participants were presented with four tasks in the following order: 0‐back, 1‐back, 0‐back, and 2‐back. During each n‐back session, participants were asked to identify and respond by clicking the left mouse button to the target letter (shown in green bold), which was a letter "W" for n = 0 or the letter matching the n th letter preceding it for n = 1 or n = 2. C) Data processing at the individual level. Noise and trend were filtered from raw near‐infrared intensities during preprocessing, and differential Beer‐Lambert Law yielded relative concentration signals of oxyhemoglobin (HbO), deoxyhemoglobin (HbR) and total hemoglobin (HbT = HbO+HbR). Representative recordings from a young participant during the 2‐back task are shown on the left (HbO, HbR) and on the right (HbT). NVC responses were assessed using a General Linear Model (GLM) approach; the corresponding brain activation is characterized by regression coefficients (β weights) of the model. For FC analysis, Pearson correlation coefficients were determined for each pair of HbT* signals from different channels yielding an adjacency matrix from which brain network properties were derived in subsequent steps. For further details of the analyses, see the main text.