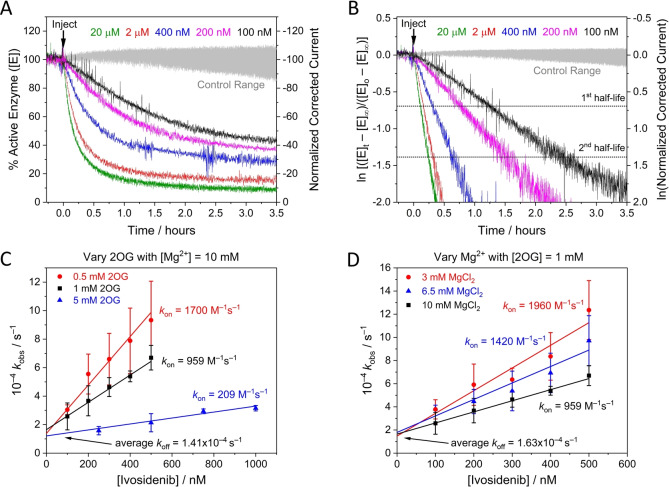
Figure 3.
Kinetic plots for IDH1 R132H inhibition at different Ivosidenib, 2OG, and Mg2+ concentrations (A) Decrease in the amount of active IDH1 R132H versus time (using enzyme rate/current as a proxy, see Supporting Information) following injection of different Ivosidenib concentrations (0.1–20 μM). The data in panel A were corrected for film loss (see Materials and Methods); uncorrected data are presented in Figure S2A. (B) Data from panel A plotted logarithmically (Eq. S11) showing that inhibition exhibits pseudo first‐order reaction kinetics for over two half‐lives. The equilibrium value for each data set was obtained from the film loss corrected plot (panel A). (C and D) Observed rate constant (k obs) values for IDH1 R132H inhibition at different Ivosidenib concentrations and with varied concentrations of 2OG (C) and MgCl2 (D). The slope=k on, the intercept=k off, and intercept/slope=K d (see Eq. 2). Conditions: (FNR+IDH1R132H)@ITO/PGE electrode, electrode area 0.06 cm2, electrode rotation rate 1000 rpm, temperature 25 °C, E=−0.5 V vs SHE, O2<1 ppm, volume 4 mL, pH=8 (20 mM each of: MES, TAPS, CHES), 10 μM NADPH, enzyme loading ratios (molar): FNR/IDH1R132H; 1/2.5. The data in panel C were measured at MgCl2=10 mM; the data in panel D were measured at 2OG=1 mM. Note: data in black in panels C and D are the same.

