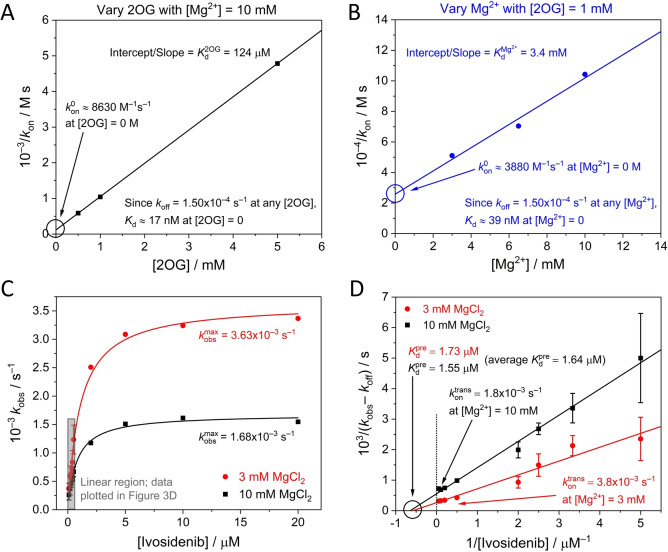
Figure 4.
(A and B) k on data from the lines of best fit in Figure 3C and D plotted using Eq. 6 to obtain limiting Ivosidenib values (and K d values) where [2OG] and [Mg2+] equal 0 M. (C) Plot showing how k obs varies with the Ivosidenib concentration at two concentrations of Mg2+ ([2OG]=1 mM). The rate of inhibition is initially linear with increasing inhibitor concentrations but ultimately reaches a limiting value that is Mg2+ dependent. The grey rectangle re‐shows the data from Figure 3D. The k obs values outside of the linear region were measured under the same experimental conditions as those described in Figure 3D (2OG=1 mM); each of these data points represents a single experiment. (D) Data from Figure 4C plotted according to Eq. 11 to obtain and values.

