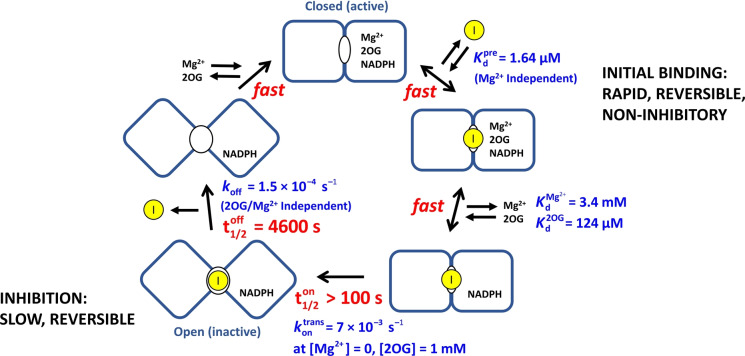
Figure 6.
Timeline for the inhibition of IDH1 R132H by Ivosidenib showing the fast and slow steps involved. For simplicity, the binding/dissociation steps for 2OG and Mg2+ are shown at a single monomer active site, (though there is likely half‐site reactivity). The pre‐equilibrium dissociation constant, , was measured from data shown in Figure 4D. and were determined from data shown in Figure 4 panels A and B, respectively. For the subsequent slow steps, the t1/2 values are first‐order complex half‐times calculated using the rate constants given in blue for each step. The value presented is the limiting (fastest) rate, which was determined by plotting the Mg2+‐dependent values measured in Figure 4D against [Mg2+] and extrapolating to [Mg2+]=0 M.

