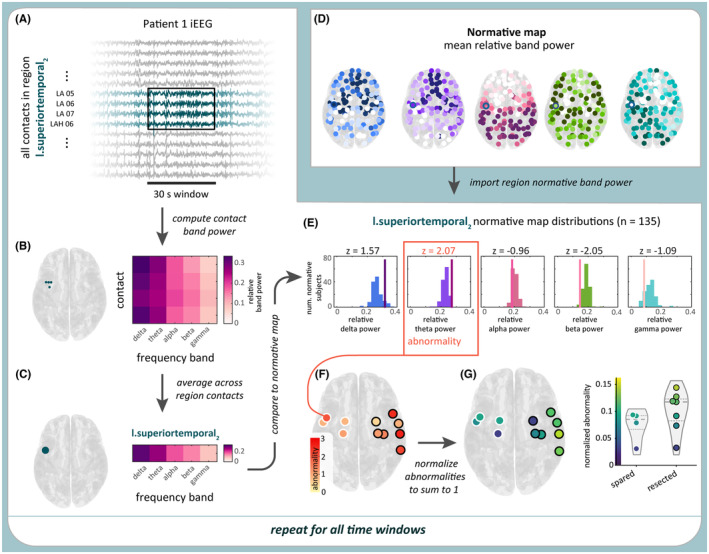
FIGURE 1.

Computing band power abnormality in a sample time window and region in Patient 1. (A) Sample 30‐s time window of intracranial electroencephalographic (iEEG) data in a subset of Patient 1's contacts. All contacts within a sample region, l.superiortemporal2, are highlighted in blue. (B) From the 30 s of iEEG data, the relative log band power of each of the four contacts in the sample region was computed. (C) Averaging relative log band power across all of the region's contacts produces the region's relative band power. (D) Relative log band power was also computed in a separate cohort of 249 subjects, yielding a normative map of this measure. (E) Patient 1's regional relative band power was then z‐scored relative to the normative map. The region's abnormality was defined as the maximum absolute z‐score (here, 2.07) across the five frequency bands. (F) The process is repeated for all regions. (G) The abnormality values are normalized so their sum equals 1 and plotted for resected and spared regions. This process was repeated for all time windows in each patient.
