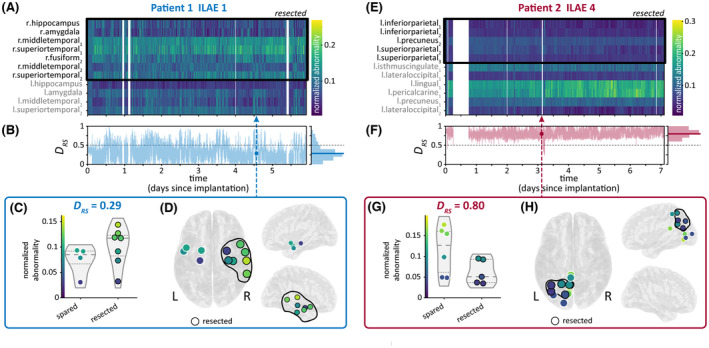
FIGURE 2.

Time‐varying abnormalities and in sample Patients 1 (A–D) and 2 (E–H). (A, E) Heatmap of regional maximum absolute band power abnormalities, with each column corresponding to a 30‐s time window in the patient's intracranial electroencephalographic recording. Abnormalities in each time window are normalized to sum to 1, thus showing each region's contribution to the total abnormality in that time window. Resected regions are outlined with a black box. (B, F) Time‐varying computed from band power abnormalities. Histogram to the right of each plot shows the distribution of in each recording, with the median marked with a bold horizontal line. The circle and dashed vertical line mark a sample time window that had a equal to the patient's median . is also shown with a dashed black line for reference. (C, G) Normalized abnormalities of spared and resected regions in the sample time window with equal to the patient's median . Quartiles of the abnormality distributions are marked with dashed lines. (D, H) The same abnormalities on a brain surface from top and side views. ILAE, International League Against Epilepsy.
