
FIGURE 3.
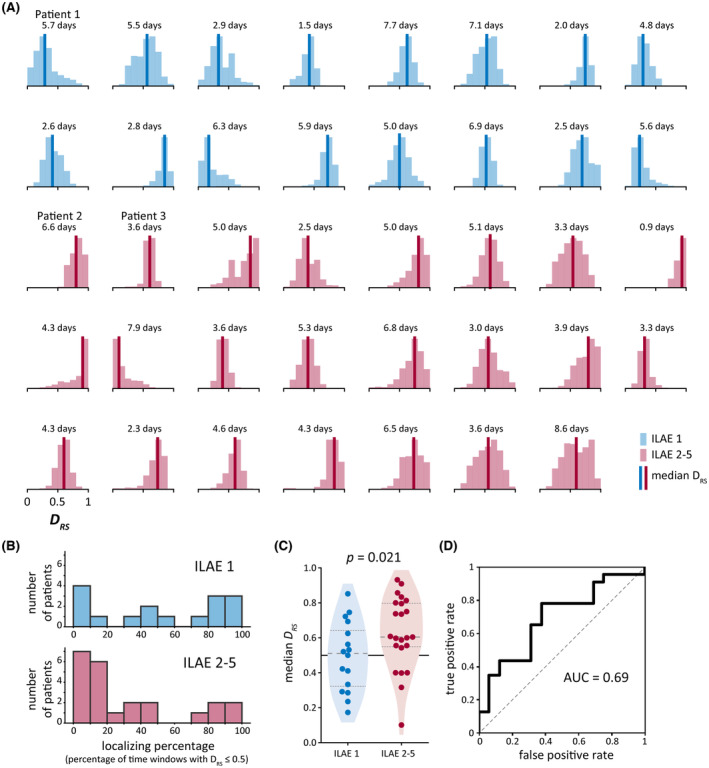
Variability in across patients. (A) Distribution of in each patient's intracranial electroencephalographic recording, as shown in sample patients in Figure 2B,F. Bold vertical lines show the median of each distribution. Number of days of data used to compute each distribution is also provided. (B) Localizing percentage of time windows (i.e., percentage of time windows with .5) in our cohort. (C) Comparison of median in patients who were seizure‐free (International League Against Epilepsy [ILAE] = 1) versus not seizure‐free (ILAE = 2–5) after surgery. Quartiles of the distributions are marked with dashed lines. (D) Receiver operator characteristic curve using median as a binary classifier of patient surgical outcome. AUC, area under the curve.