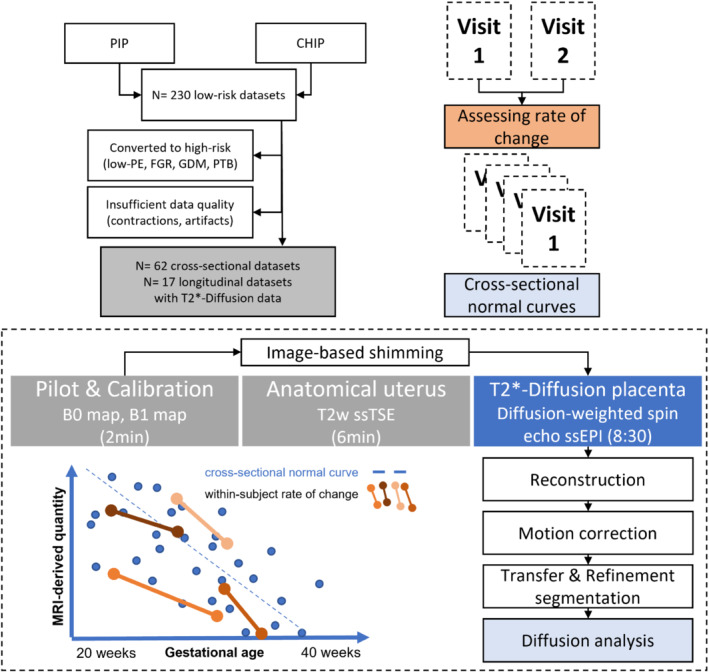
FIGURE 1.

Study overview displaying the cross‐sectional and within‐subject evaluation, the flow chart of participants, and the acquisition and analysis pipelines

Study overview displaying the cross‐sectional and within‐subject evaluation, the flow chart of participants, and the acquisition and analysis pipelines