
FIGURE 3.
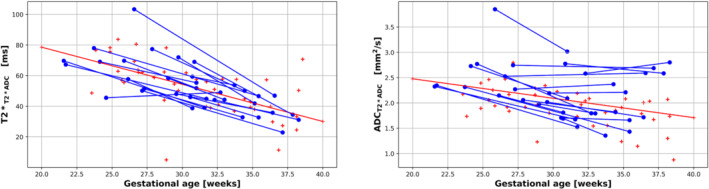
Gestational age at the time of the scan (x‐axis) and whole placental values (left) and ADC values (right) from the ADC model (y‐axis). The cross‐sectional data points are shown with red crosses and the longitudinal data points with blue dots. The blue lines link measurements for participants who were scanned twice during the same pregnancy (longitudinal cohort). The red line represents the line of best fit, obtained by linear regression, for the cross‐sectional cohort