
FIGURE 2.
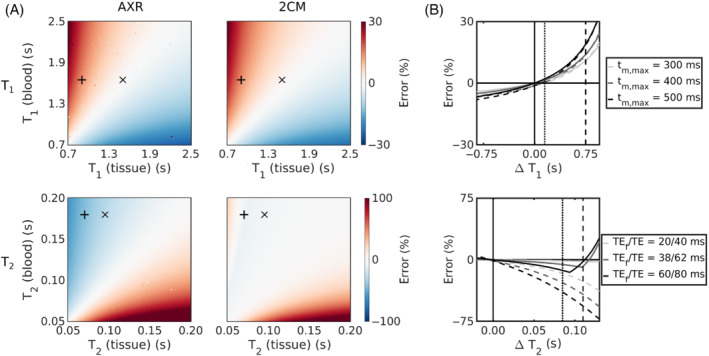
Assumption of infinite relaxation times. (A) The errors in exchange rate estimates are shown for a range of finite compartmental (top row) and (bottom row) values for the AXR (left column) and (right column) models. Expected blood/tissue values in white matter (WM) () and grey matter (GM) () are highlighted. (B) The impact of different maximum mixing times on the error in exchange rate estimates is shown for a range of differences (top); the impact of different echo times is shown for a range of differences (bottom). The AXR and models are represented by the dashed and solid lines, respectively. Expected relaxation time differences ( ) in WM and GM in vivo are indicated by the vertical dashed and dotted lines, respectively.