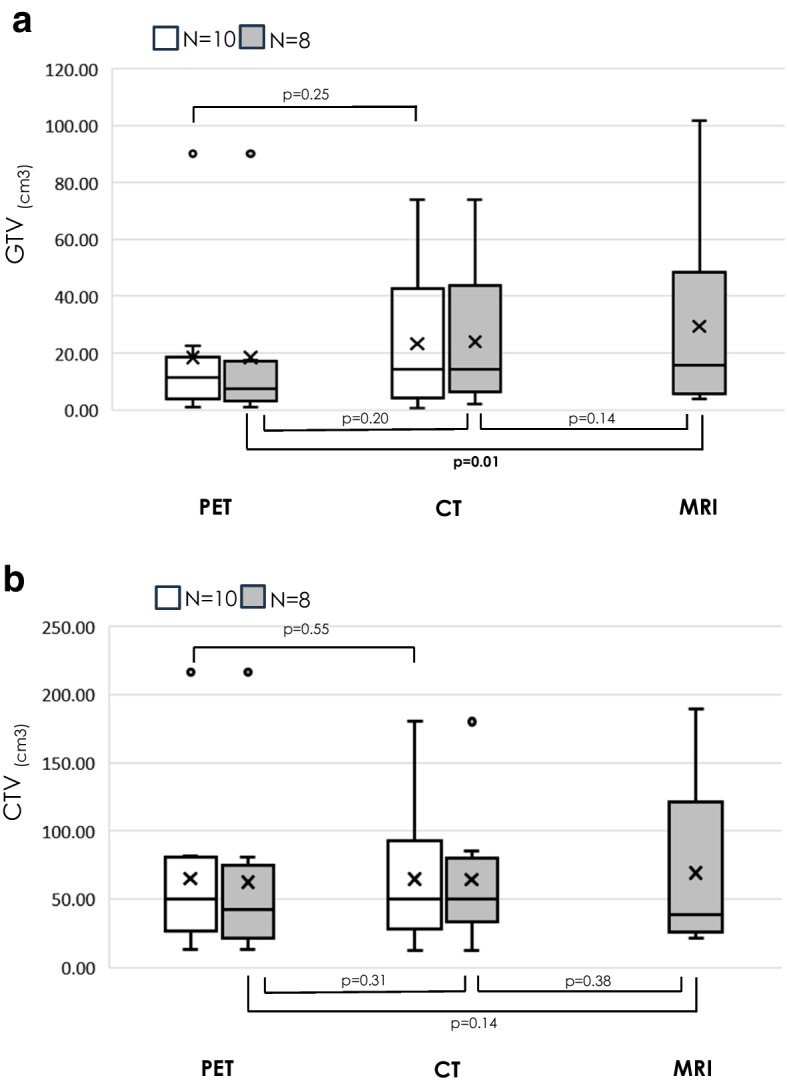
Fig. 2.

Box-and-whisker plots of GTV (a) and CTV (b) determined for each modality. The bottom and top of the boxes denote the 25th and 75th percentiles, respectively; line inside the box shows the median; crossmark shows the average; ends of the whiskers denote the maximum and minimum. Comparisons were made between each two groups with N = 10 and N = 8 comparable individuals. GTVmean (range) for each modality, GTVPET was 18.3 (0.8–90.3) cm3 for N = 10 and 18.4 (0.8–90.3) cm3 for N = 8, GTVCT was 23.3 (0.7–74.0) cm3 for N = 10 and 24.0 (1.9–74.0) cm3 for N = 8, GTVMRI was 33.9 (4.0–101.8) cm3 for N = 8. CTVmean (range) for each modality, CTVPET was 64.7 (13.0–216.6) cm3 for N = 10 and 62.5 (13.0–216.6) cm3 for N = 8, CTVCT was 64.7 (12.2–180.0) cm3 for N = 10 and 64.2 (12.2–180.0) cm3 for N = 8, CTVMRI was 86.0 (21.1–211.3) cm3 for N = 8
