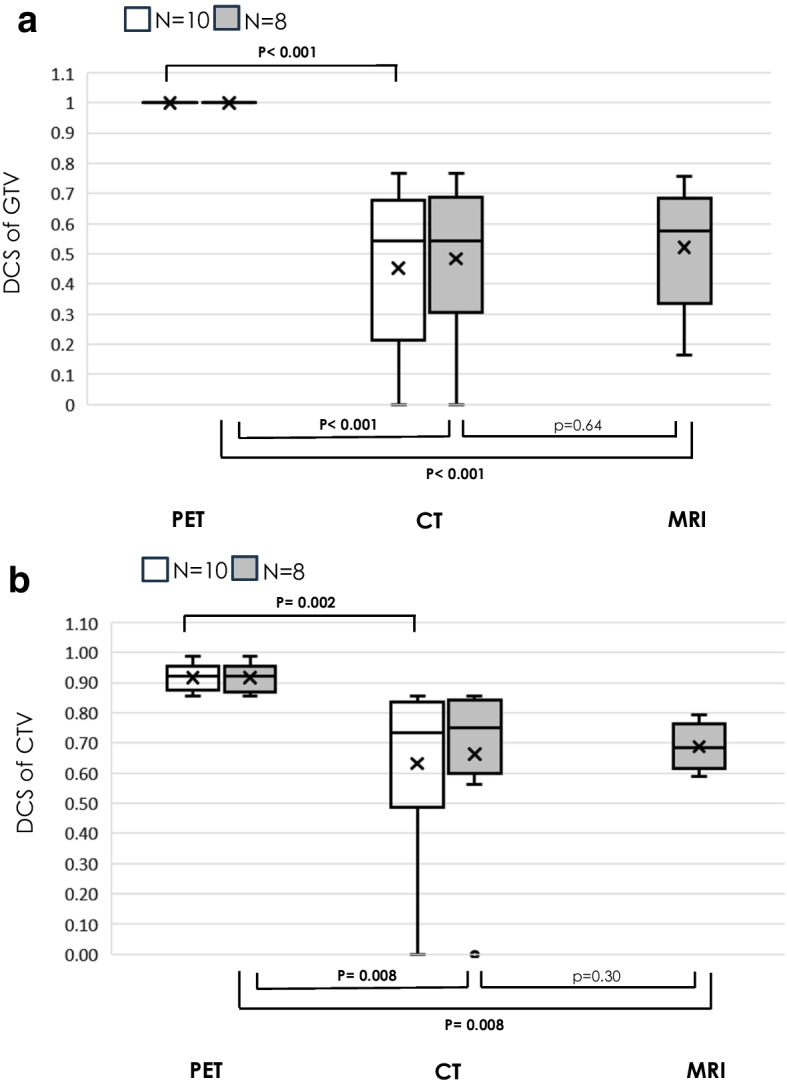
Fig. 3.

Box-and-whisker plots of DSC of GTV (a) and CTV (b) determined for each modality. Comparisons were made between each two groups with N = 10 and N = 8 comparable individuals. DSCmean (range) of GTV for each modality, DSC of GTVPET was 1.0 (1.0–1.0) for N = 10 and N = 8, DSC of GTVCT was 0.45 (0–0.77) for N = 10 and 0.49 (0–0.77) for N = 8, DSC of GTVMRI was 0.52 (0.16–0.76) for N = 8. DSCmean (range) of CTV for each modality, DSV of CTVPET was 0.92 (0.86–0.99) for N = 10 and 0.92 (0.86–0.99) for N = 8, DSC of CTVCT was 0.63 (0–0.86) for N = 10 and 0.66 (0–0.86) for N = 8, DSC of CTVMRI was 0.69 (0.58–0.85) for N = 8. DSC = Dice similarity coefficient
