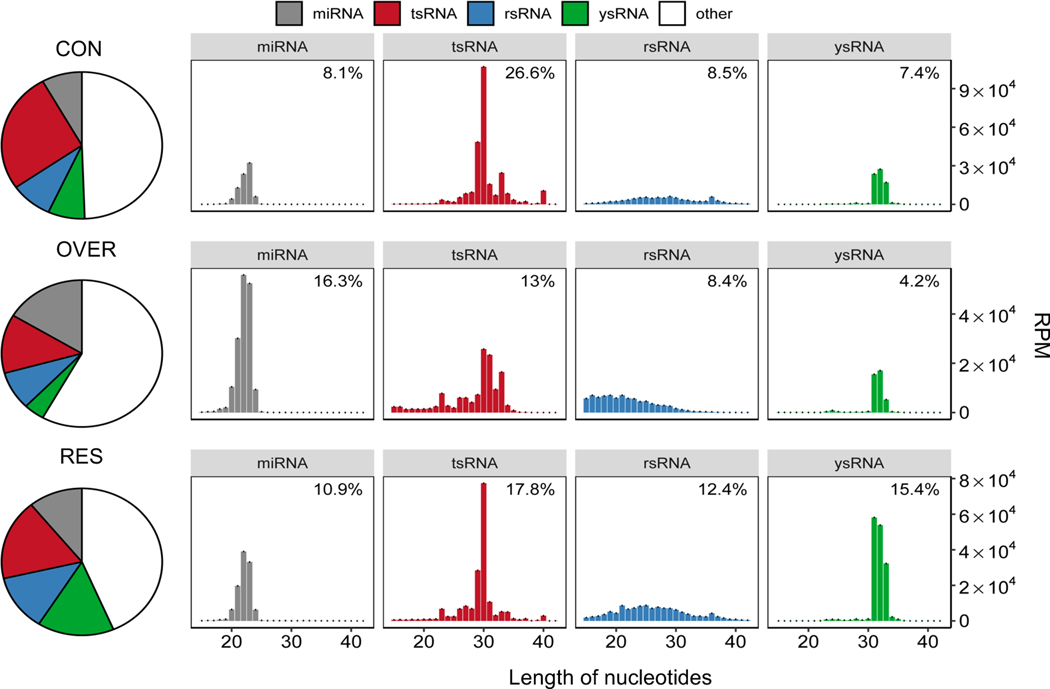
Figure 2.
Sperm sncRNAs (miRNAs, tsRNAs, rsRNAs and rsRNAs) are dynamically regulated in response to maternal restricted- and over-nutrition (RES and OVER) during gestation in F1 males. The results show length distribution and pattern changes (right panel) of different sncRNAs in sperm across different diet groups (CON, OVER, and RES). The data represent means ± s.e.m. The histogram details the percentage of each sncRNA as shown in the bar chart. The abundance of sncRNAs is measured as reads per million (RPM) as shown in the y-axis corresponding to the length of each category of sncRNA as shown in the x-axis.

