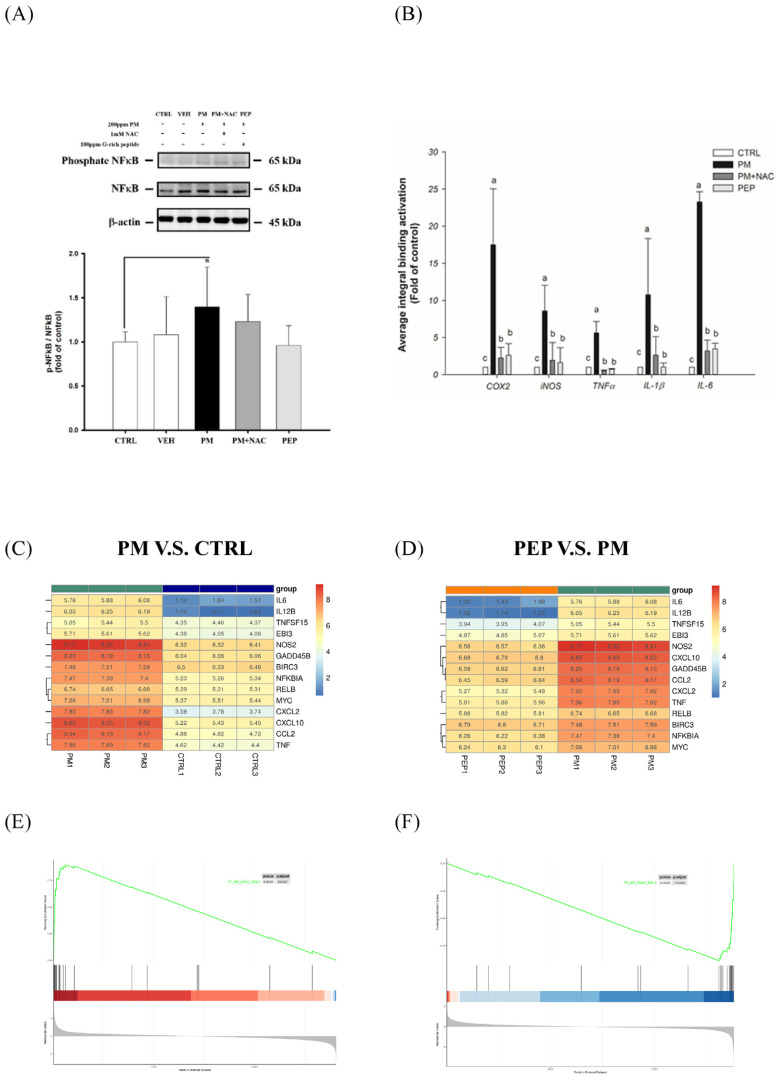
Fig. 5.
The regulatory effect of NF-κB pathway on PM-MHS model.
Immunoblot analysis of phosphor–NF–κB/NF-κB ratio (A), Chromatin immunoprecipitation analysis of binding genes of RELA to the promoter regions (B), Heat-map clustering of transcription factor bind profiles in RELA subunit (C, D) and Gene set enrichment analysis (GSEA) (E, F) illustrate PM-induced NF-κB and pro-inflammatory genes. The DEGs with adjusted p-value <0.05 and log2 fold change >1.5 are shown. CTRL: without treatment; PM: treated with only PM (200 ppm) for 24 h; PEP: co-treated with 200 ppm PM and 100 ppm G-rich peptide from FCS proteins for 24 h.

