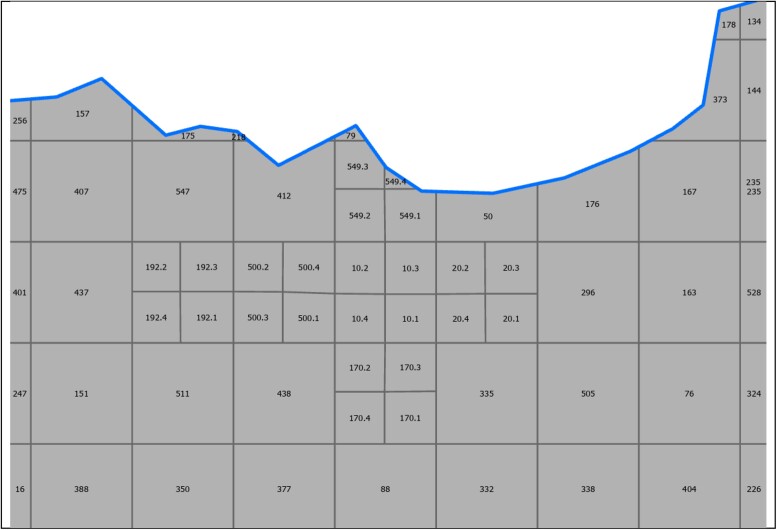
Figure 3.
Subclusters (clusters 10, 170, 192, 500, and 549) in the Enterics for Global Health–Kenya study site, divided into quadrants based on estimated population size. Subclusters are shaded. Clusters along the boundary of the catchment area (thicker boundary line) are truncated; clusters 157 and 175 are examples of truncated clusters.

