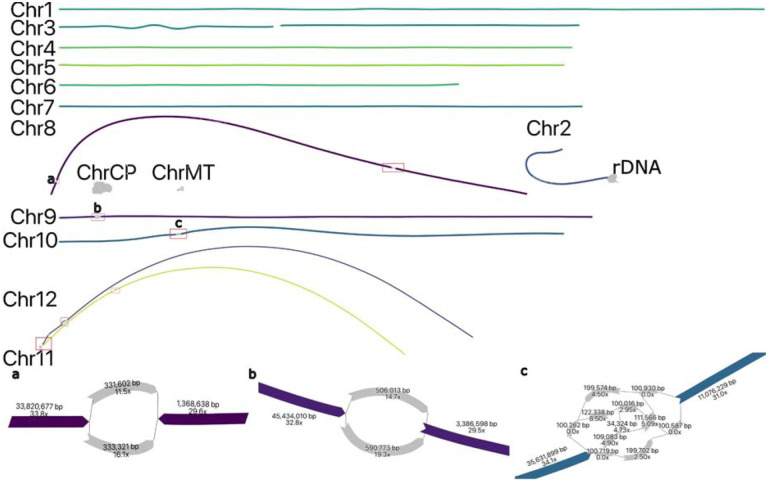
Figure 4: Duplex + ultra-long assembly graph for S. lycopersicum prior to manual resolution.
In the tomato assembly graph, most chromosomes are linear and fully resolved, except for regions of remaining heterozygosity (highlighted in red boxes): the shared sequence between chromosomes 11 and 12 (red box bottom left), a gap on Chromosome 3, and the 45S rDNA array on Chromosome 2. ChrCP denotes the chloroplast and ChrMT denotes the mitochondria genomes, respectively. The callouts (a, b, c) show some unresolved structures in detail. The simple bubble on Chr 8 (a) and a simple bubble on Chr 9 (b) were resolved by picking a random haplotype. The region on Chr 10 (c) corresponds to a low-coverage Duplex region, indicated by low coverage on the nodes. These regions were gap-filled using ONT UL sequences, generating additional noise in the graph. This prevents automated resolution which requires support from at least twice as many ONT UL reads as the next best. A path consistent with the largest number of ONT UL sequences was selected.

