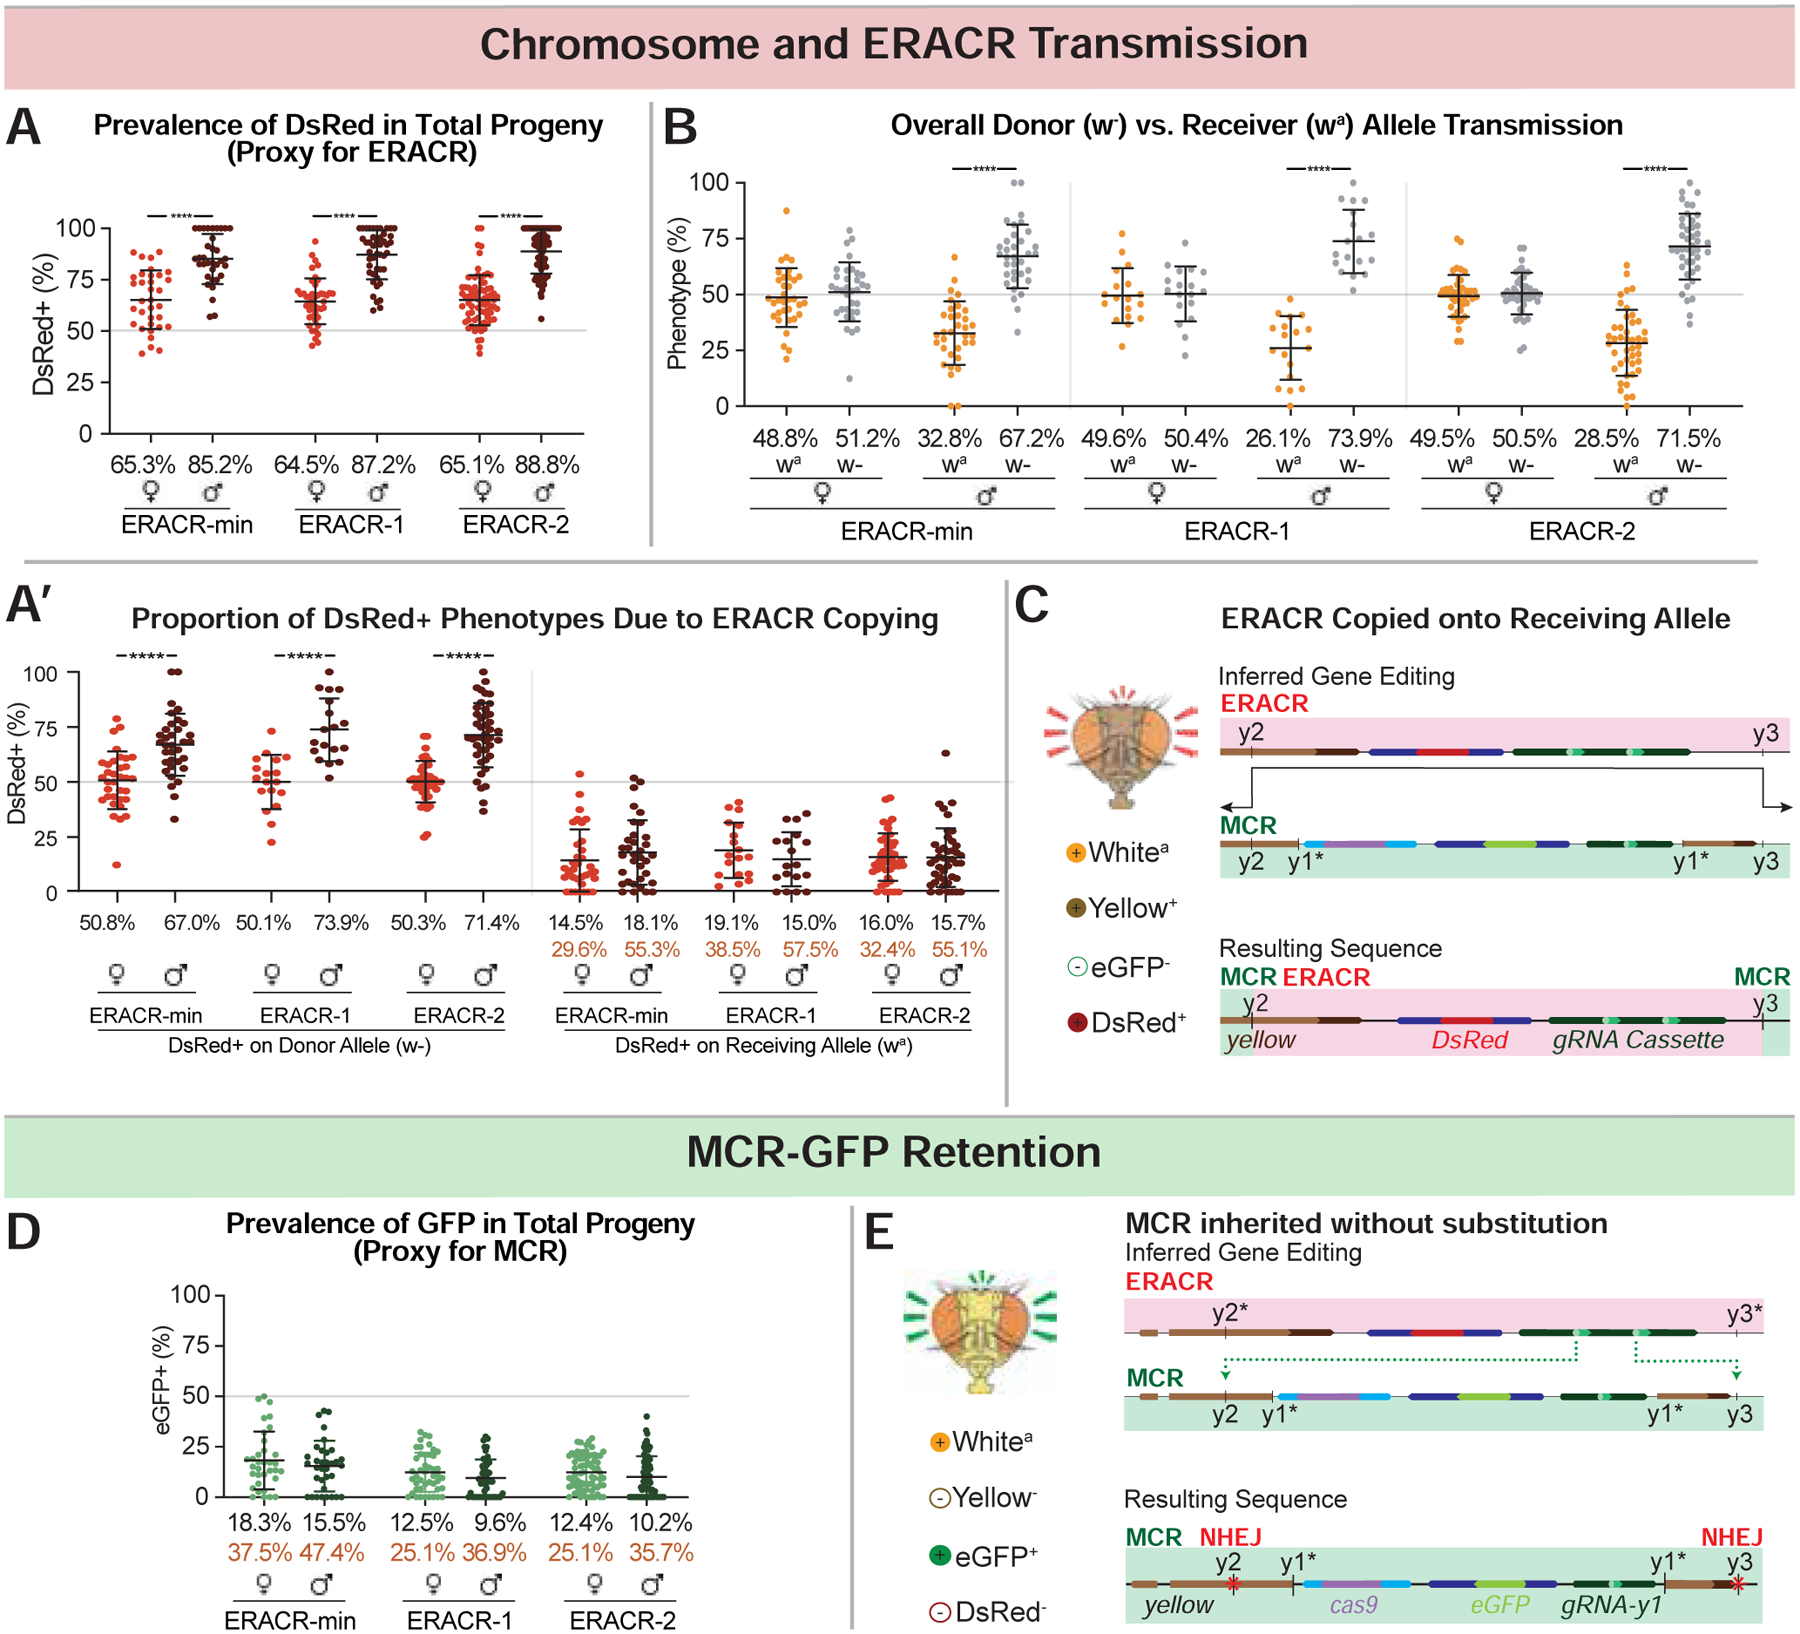
Figure 4: ERACRs delete and replace the MCR-GFP drive.

Phenotypic frequencies and deduced gene conversion events in F2 progeny from crosses depicted in Fig. 3A. (additional crossing schemes in Figs. S13A–E). Black type = mean of percentages across all vials and orange type = estimated receiver conversion frequencies (e.g., DsRed wa males/total wa males) (see Data S3 for details). A) DsRed+ inheritance is a proxy for scoring ERACR prevalence (DsRed+, GFP− and DsRed+, GFP+ progeny included). A’) The subset of data plotted in panel 4A with traceable donor and receiver chromosomes re-plotted by donor (w−; left graph) versus receiver (wa; right graph) chromosomes. B) Proportion of F2 males or females inheriting the donor (w−) versus receiver (wa) chromosome. C,E) Schematics illustrating predicted gene conversion events responsible for specific phenotypes: sequences of relevant junctions shown in (Fig. S14). D) GFP inheritance is a proxy for MCR-GFP prevalence (DsRed+,GFP+ plus DsRed−,GFP+ F2 progeny). E) MCR-GFP alleles, although intact, have NHEJ-induced indels at the y2 and y3 cut sites.
