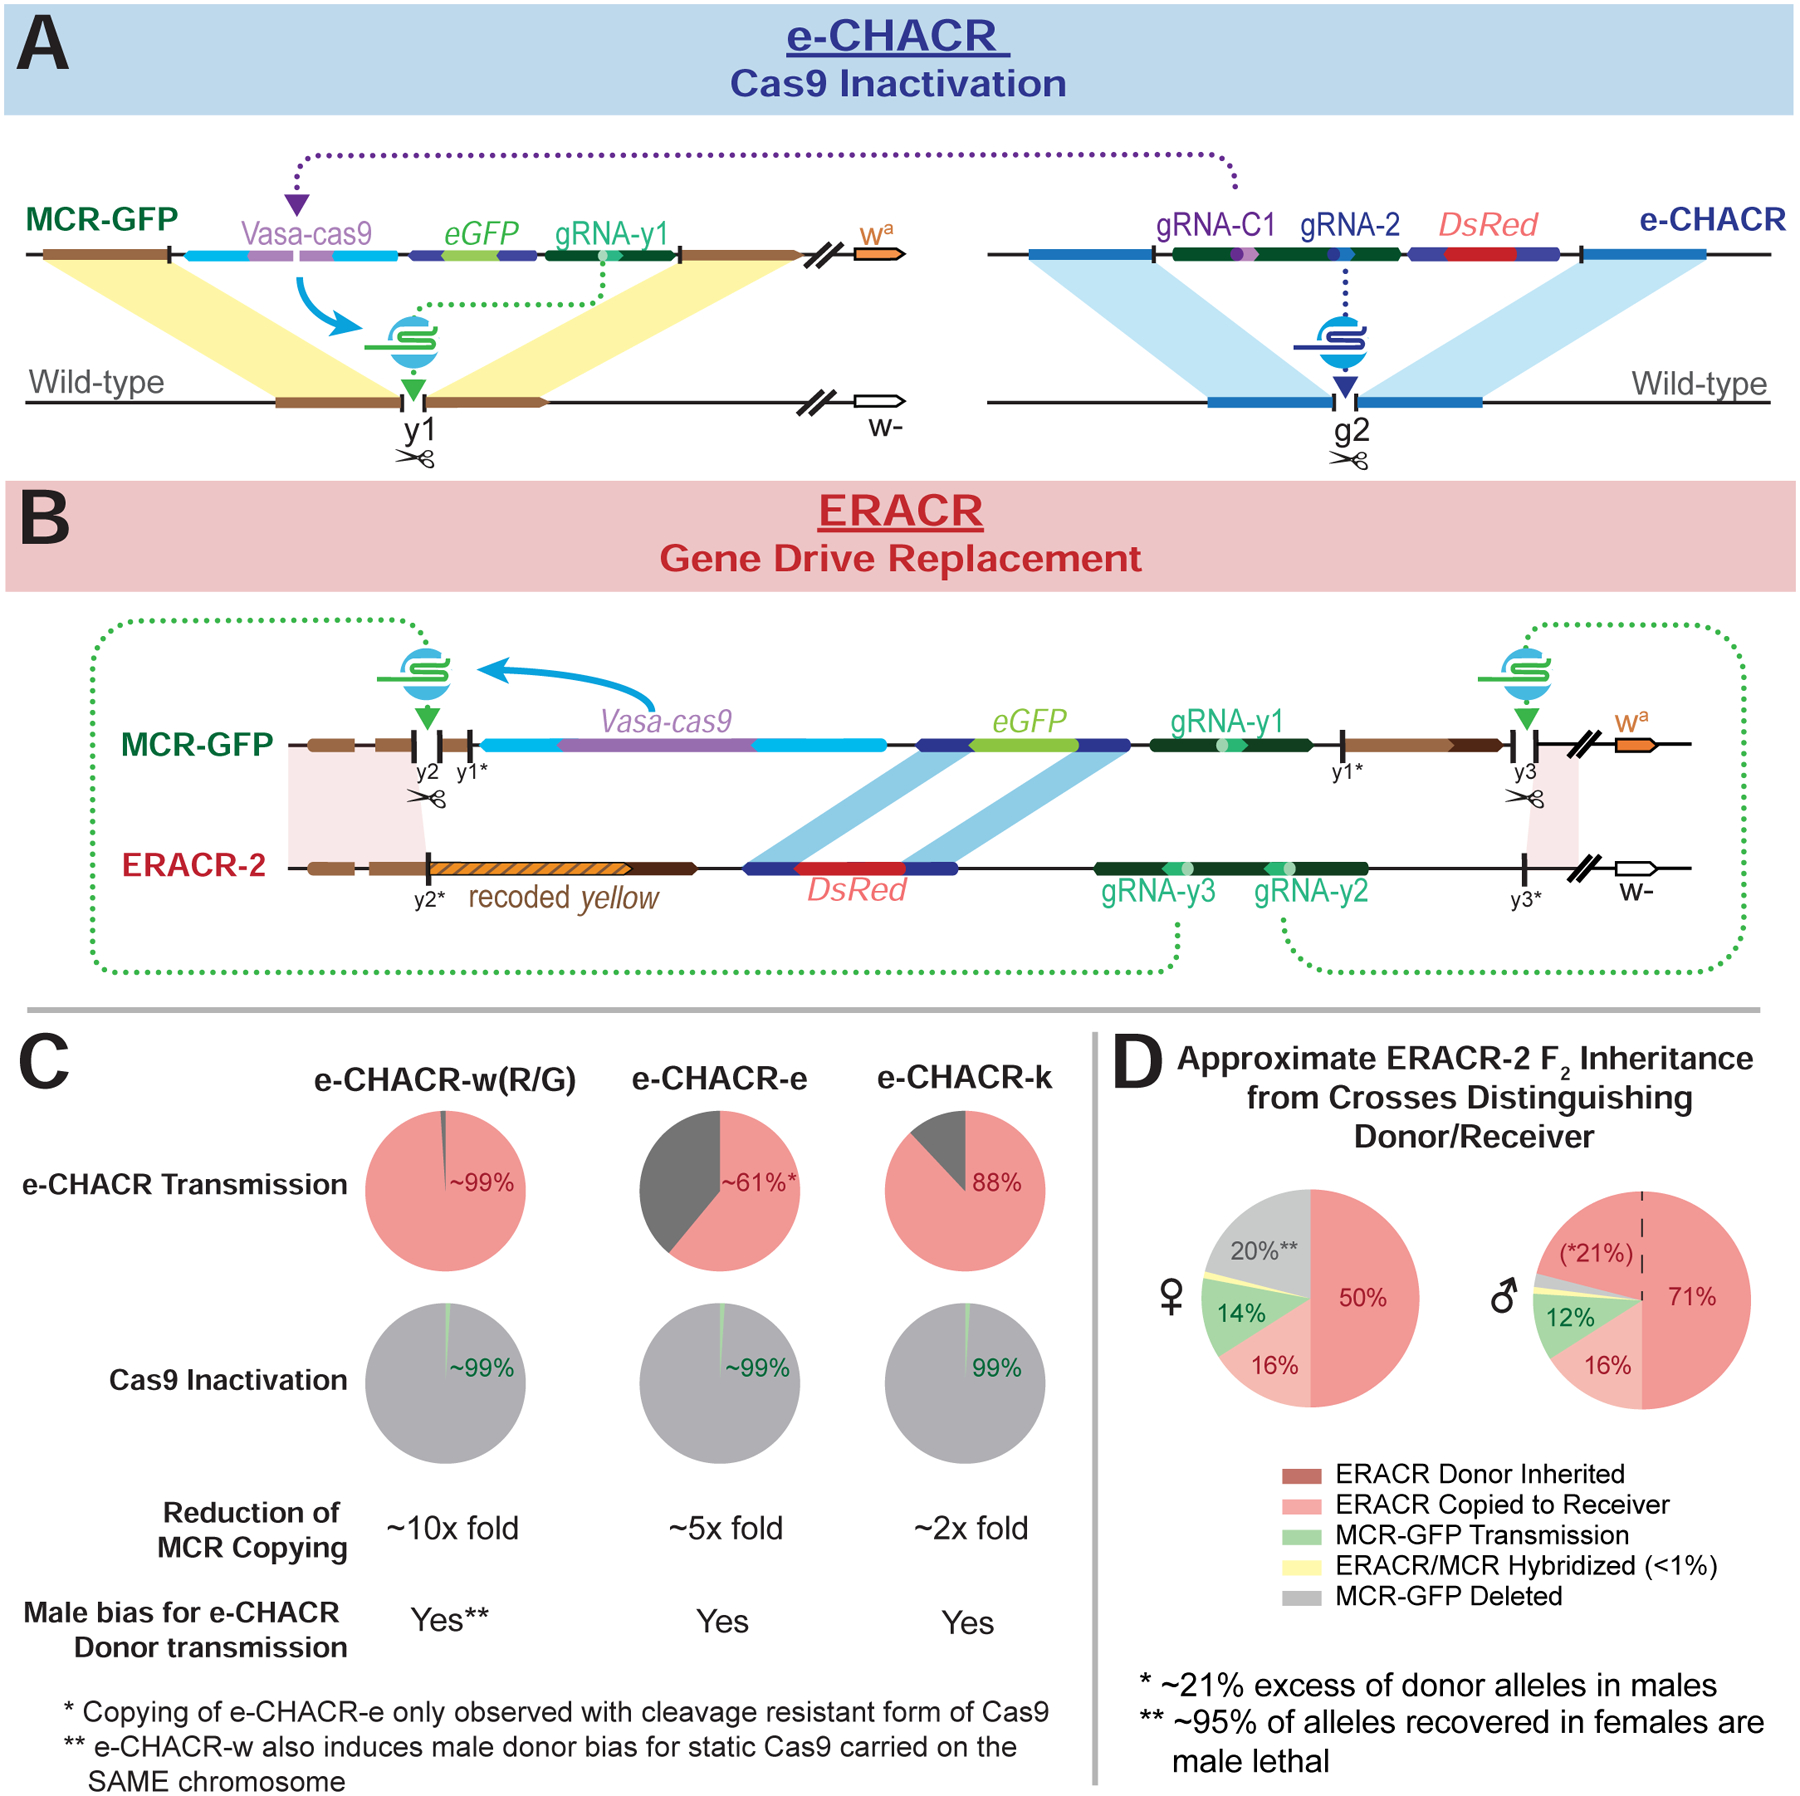
Figure 8: Summary Diagrams.

A) Diagram illustrating the generic action of the e-CHACRs against the MCR-GFP gene-drive. B) Diagram outlining the structures and homologous sequences serving as sites for potential SDSA-mediated partial copying between ERACR-2 and the MCR-GFP constructs (lightly shaded parallelograms). y1*, y2* and y3* indicate the loss of the gRNA-y1, gRNA-y2 and gRNA-y3 cut sites accompanying genomic insertion of the MCR-GFP element (gRNA-y1) or ERACRs (gRNA-y2 and gRNA-y3). C) Pie charts summarizing key e-CHACR performance parameters. D) Pie chart summary of F2 male and female progeny outcomes derived from F1 ERACR-2/MCR-GFP master females separated by inferred donor (w− = red shaded sectors) versus receiver (wa: peach = ERACR copied, green = MCR-GFP retention; gray =MCR-GFP deleted) chromosomes.
