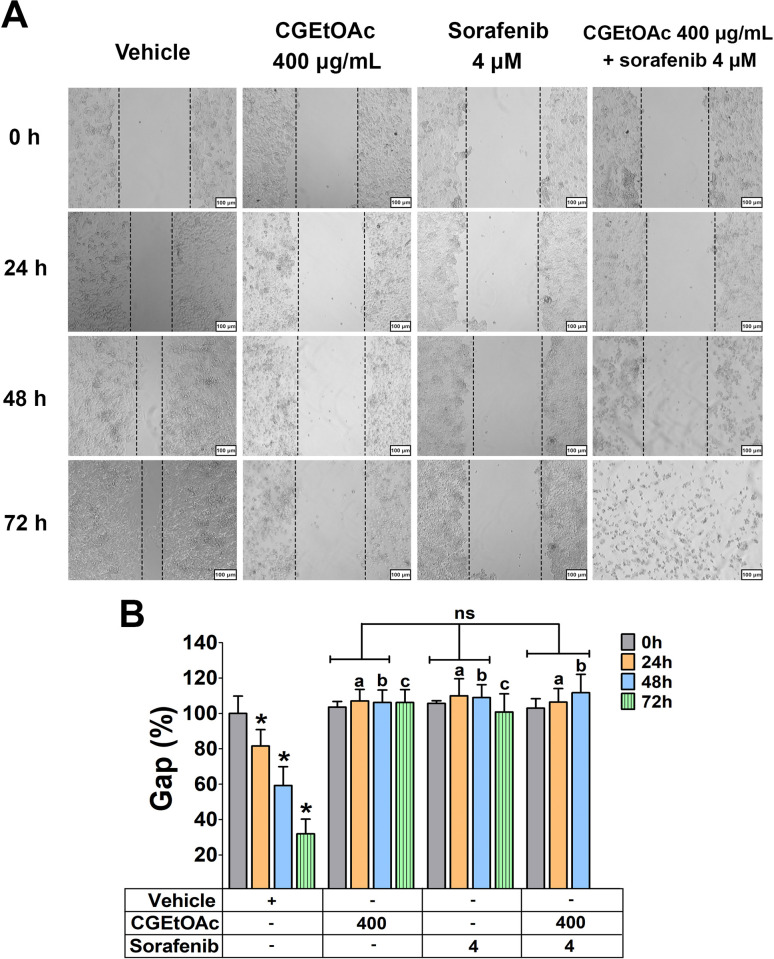
Fig 2. The migratory capacity of HepG2 cells was assessed through a 0–72 h incubation with CGEtOAc at 400 μg/mL and sorafenib at 4 μM, both singly and in combination.
(A) Wound healing images were captured with a magnification bar of 500 μm. (B) The percentage of the gap was depicted as a bar graph. Cells treated with 0.8% DMSO represented the vehicle control. The significant differences in data, presented as the mean ± SD from at least three different experiments, were investigated with a one-way ANOVA using Tukey’s HSD test: *; p < 0.05 vs the 0 h of the vehicle control, a; p < 0.05 compared to 24 h of incubation in the vehicle group, b; p < 0.05 compared to 48 h of incubation in the vehicle group, and c; p < 0.05 compared to 72 h of incubation in the vehicle group, with 0 hours set at 100% for each group.

