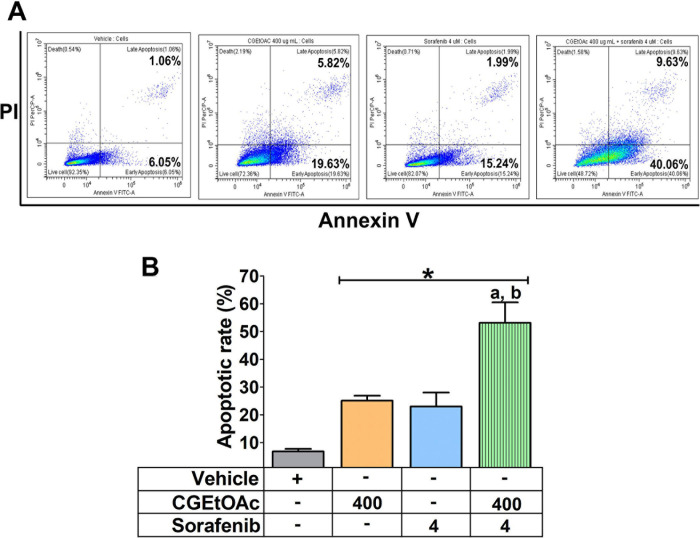
Fig 3. The apoptotic effect of CGEtOAc, sorafenib, and their combination against HepG2 cells after exposure for 24 h.
(A) Apoptotic levels in HepG2 cells were examined by flow cytometry after double labeling using annexin V and PI. (B) The levels of apoptotic cells were displayed as a bar graph. 0.8% DMSO represented the vehicle control. The significant differences in data, presented as the mean ± SD from at least three different experiments, were investigated with a one-way ANOVA using Tukey’s HSD test: *; p < 0.05 compared to the vehicle control. a; p < 0.05 compared to a single CGEtOAc treatment. b; p < 0.05 compared to a single sorafenib treatment.

