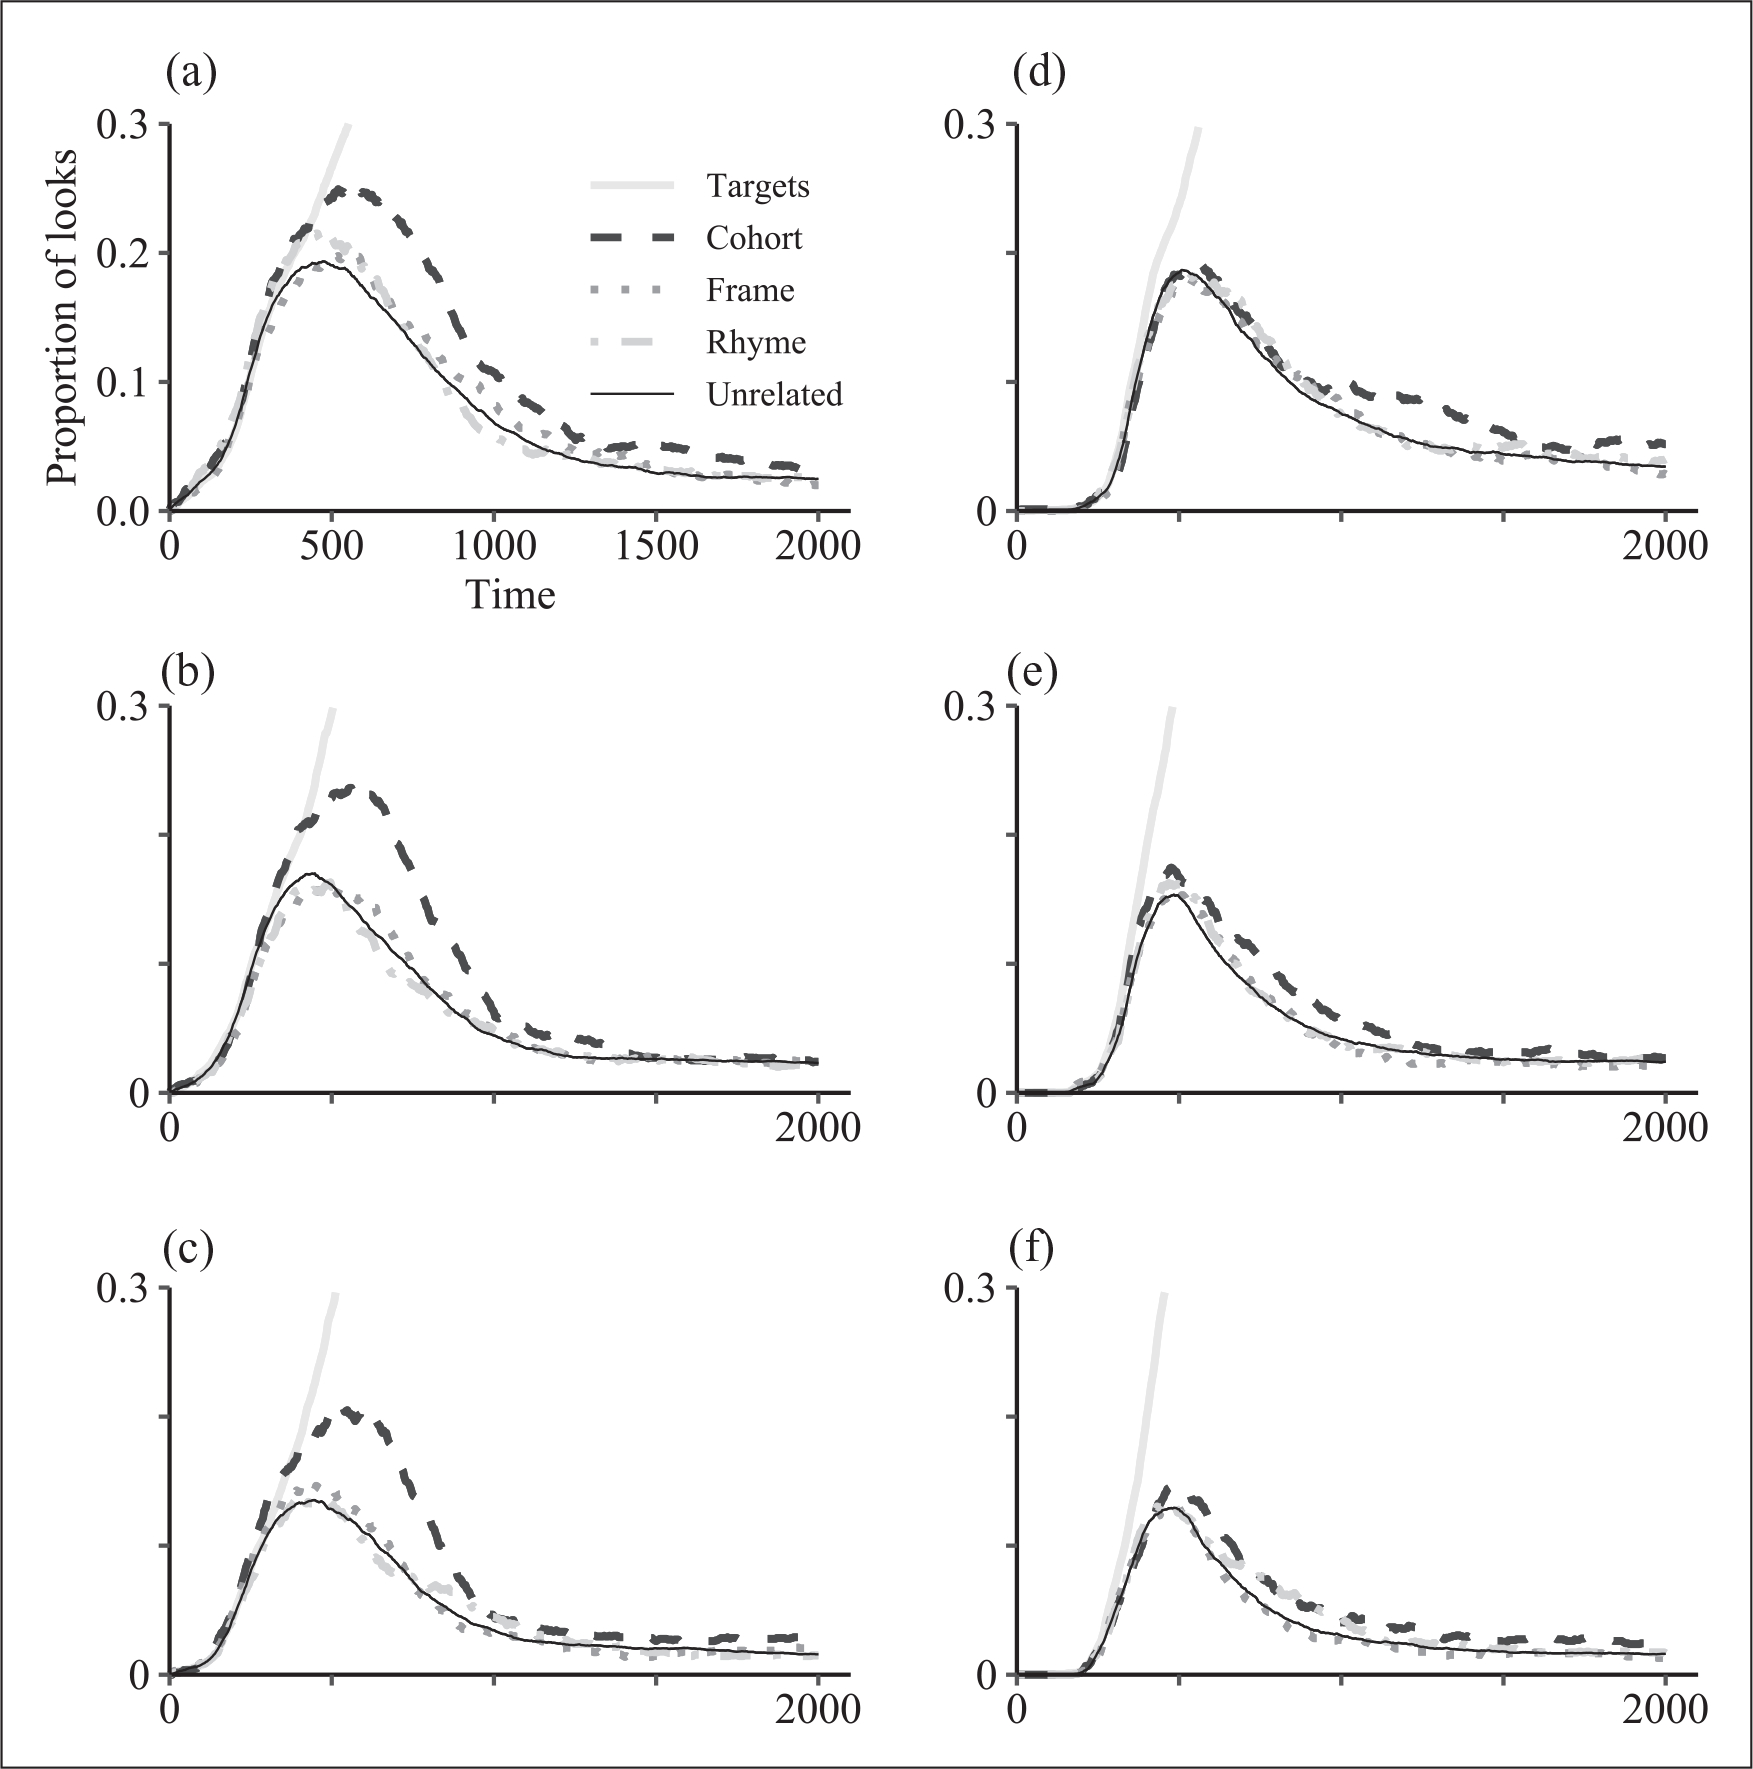
Figure 4.

The proportion of looks to each object type across time for each age group and each modality. Note that the figure is capped at a proportion of 0.3; targets rapidly exceed this. (a) Young; Spoken. (b) Middle; Spoken. (c) Old; Spoken. (d) Young; Written. (e) Middle; Written. (f) Old; Written.
