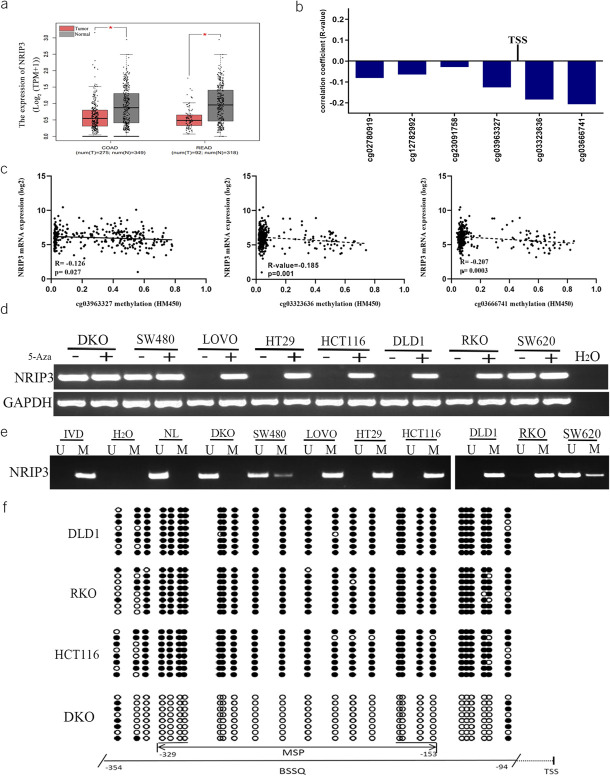
Figure 1.
The expression and methylation status of NRIP3 in CRC. (a) The levels of NRIP3 in CRC tumor tissue and normal tissue samples (TCGA + GTEx datasets). num, number; T, tumor; N, normal; COAD, colorectal adenocarcinoma cancer; READ, rectal adenocarcinoma cancer. (b) The association of NRIP3 expression and methylation status of CpG sites close to TSS site in the promoter region. TSS, transcription start site. (c) Scatter plots show representative CpG sites methylation status and NRIP3 expression association (cg03963327, cg03323636 and cg03666741). (d) Semiquantitative RT-PCR shows the expression of NRIP3 in CRC cells. 5-Aza, 5-aza-2′-deoxycytidine; GAPDH, internal control of RT-PCR; H2O, double distilled water; (−), absence of 5-Aza; (+), presence of 5-Aza. (e) MSP results of NRIP3 in CRC cells. U, unmethylated alleles; M, methylated alleles; IVD, in vitro methylated DNA, serves as methylation control; NL, normal lymphocytes DNA, serves as unmethylation control; H2O, double distilled water. (f) BSSQ results of NRIP3 in DLD1, RKO, HCT116, and DKO cells. The size of unmethylated MSP products is 183 bp. Bisulfite sequencing was performed in a 261-bp region around the NRIP3 transcription start site (from −354 bp to −94 bp). Filled circles, methylated CpG sites; open circles, unmethylated CpG sites; TSS, transcription start site.

