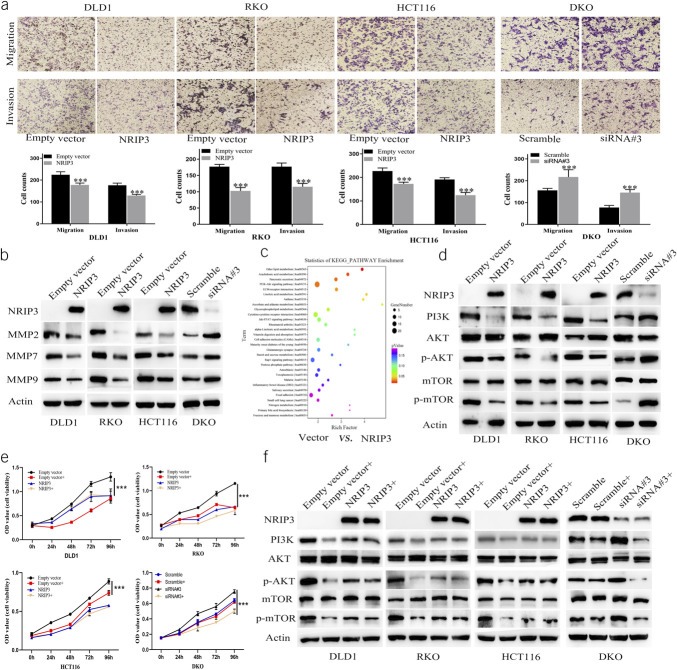
Figure 4.
The effect of NRIP3 on cell migration and invasion, PI3K-AKT signaling in CRC cells. (a) Migration and invasion results. Bar diagram represent the average number of migration and invasion cells. ***P < 0.001. (b) Western blot shows the levels of NRIP3, MMP2, MMP7, and MMP9. (c) The KEGG enrichment analysis in unexpressed vs reexpressed RKO cells. (d) Western blot shows the levels of NRIP3, PI3K, AKT, p-AKT, mTOR, and p-mTOR in CRC cells. (e) MTT assay shows cell growth curves. Empty vector: NRIP3 unexpressed cells; Empty vector +: NRIP3 unexpressed cells plus NVP-BEZ235 treatment (50 nM); NRIP3: NRIP3 reexpressed cells; NRIP3+: NRIP3 expression plus NVP-BEZ235 treatment. Scramble: siRNA negative control; Scramble+: Scramble siRNA plus NVP-BEZ235 treatment; siRNA#3: the most effective NRIP3 targeting siRNA; siRNA#3+: siNRIP3 plus NVP-BEZ235 treatment. ***P < 0.001. (f) Western blot shows the levels of NRIP3, PI3K, AKT, p-AKT, mTOR, and p-mTOR, before and after NVP-BEZ235 treatment, with or without NRIP3 expression.

