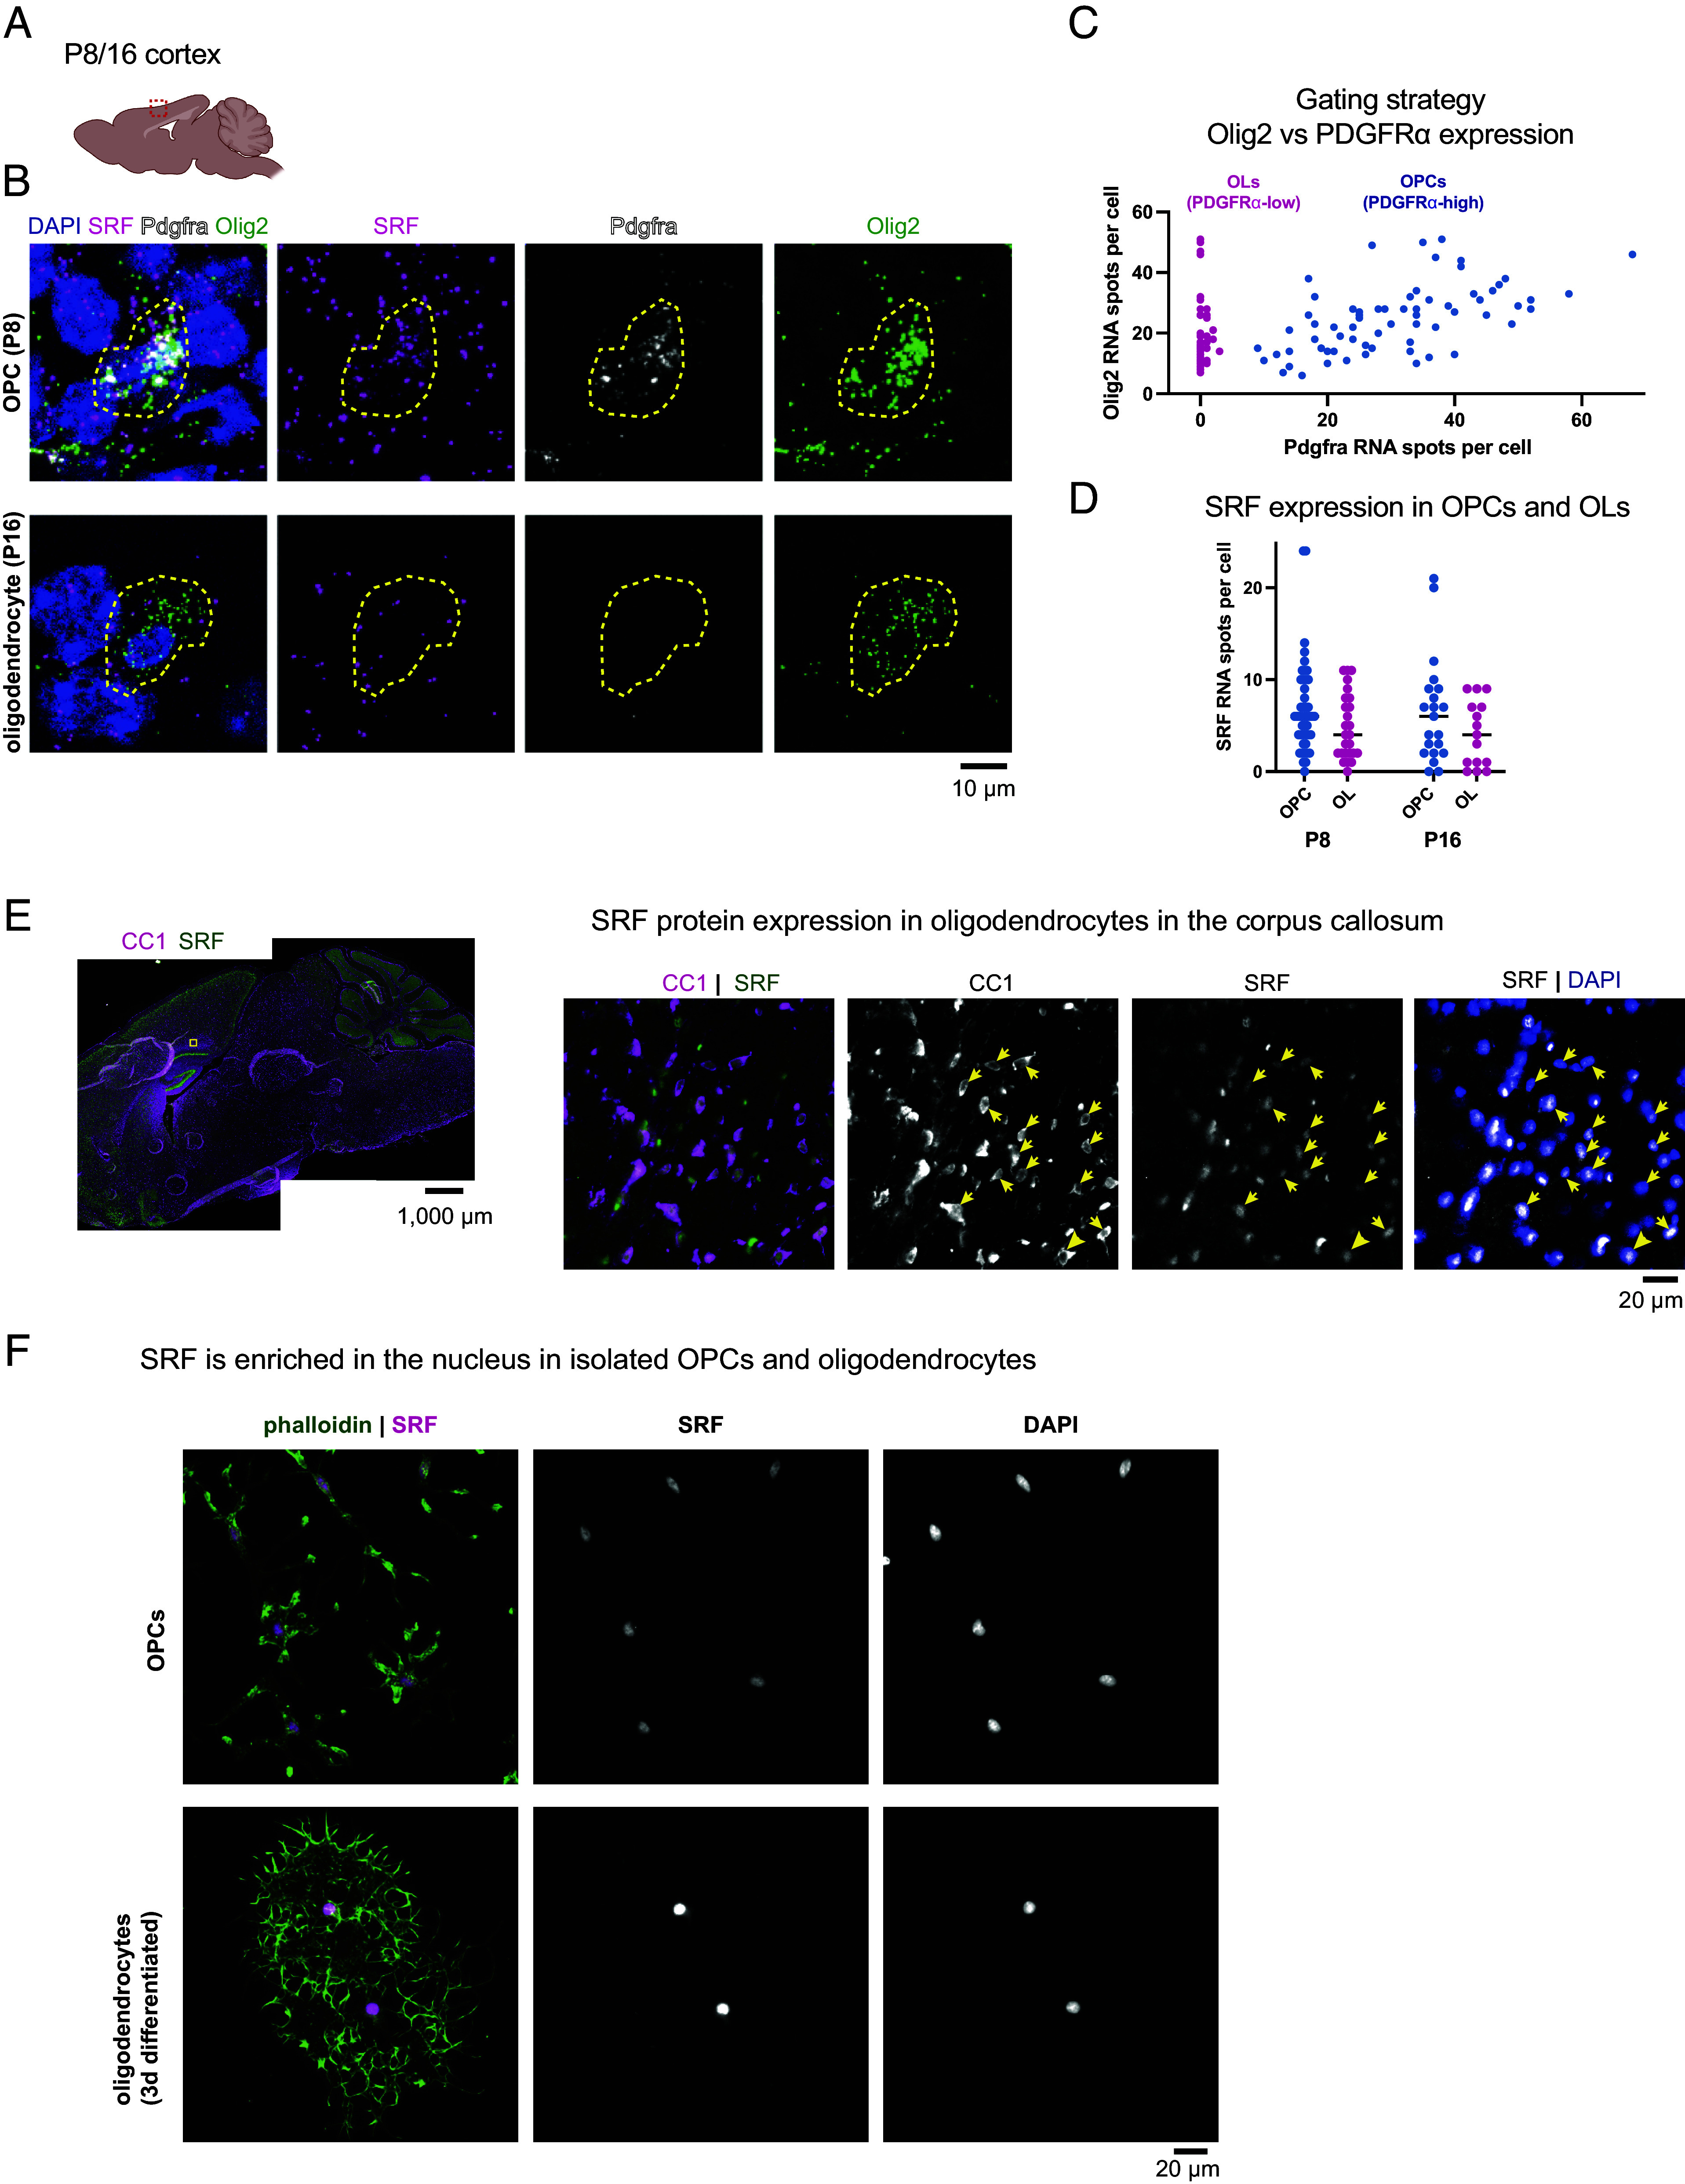
Fig. 1.

Expression of SRF in the oligodendrocyte lineage. (A) Region of interest in sagittal sections of P8 and P16 brains. (B) RNAscope for Pdgfrα, Olig2, and SRF in the cortex of P8 and P16 brains, n = 2 (Scale bar, 10 μm.) (C) Gating strategy for selection of OPCs (Pdgfrα-high) and oligodendrocytes (OLs; Pdgfrα-low) expressing cells. (D) Quantification of SRF spots per cell in OPCs and oligodendrocyte population at P8 and P16. Each dot represents a cell, bar represents the mean from all cells. n = 3 mice at each age. (E) Overview of immunostaining of a P16 mouse with CC1 (mature oligodendrocytes) and SRF and an enlargement of the corpus callosum. (Scale bar, 1,000 μm and 20 μm in the enlargement.) (F) SRF and phalloidin staining in isolated OPCs or OL differentiated for 3 d in culture. (Scale bar, 20 μm.)
