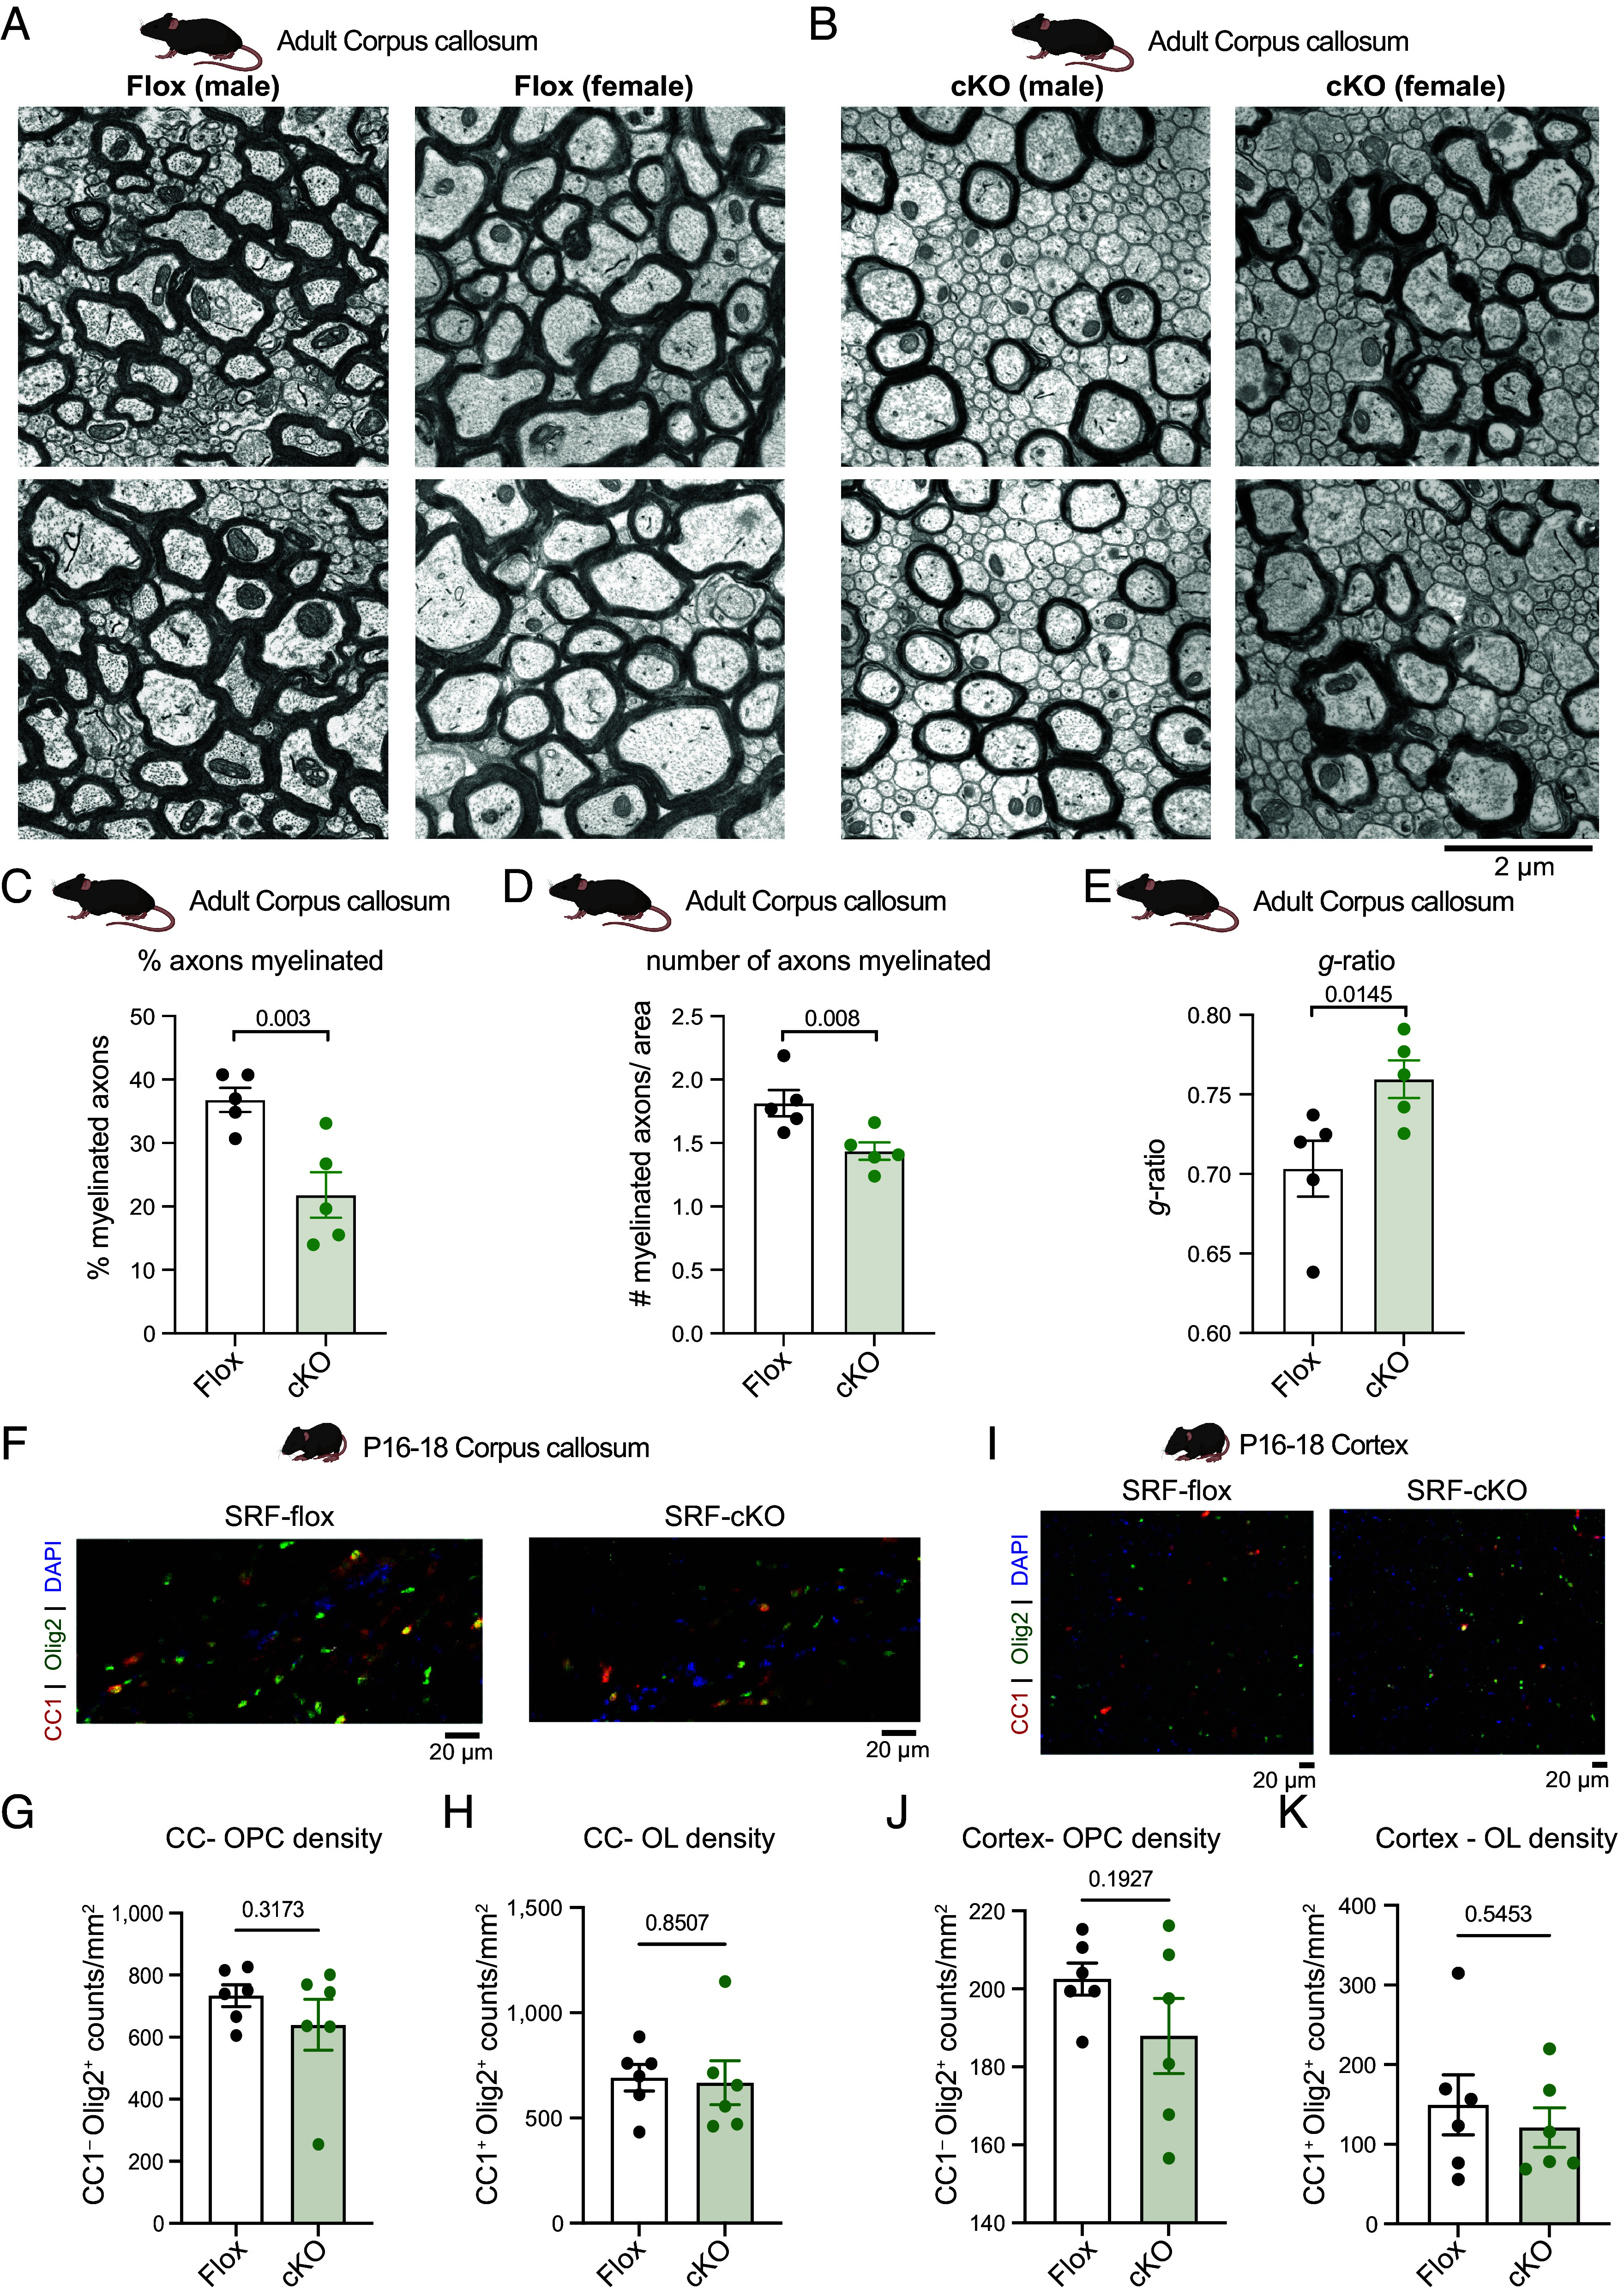
Fig. 2.

SRF is required in oligodendrocytes for myelination. (A) Representative transmission electron microscopy image of corpus callosum of adult SRF-Flox male and female mice. (Scale bar, 2 μm.) (B) Representative transmission electron microscopy image of corpus callosum of adult SRF-cKO male and female mice. (Scale bar, 2 μm.) (C) Quantification of percent axons myelinated in adult corpus callosum. Each data point is based on at least 2,500 axons counted per mouse. n = 5 animals from each genotype. Unpaired t test. (D) Quantification of number of myelinated axons per area (at least 1,000 μm2) in adult corpus callosum. Each data point is the average per mouse. n = 5 animals from each genotype. Unpaired t test. (E) Quantification of the g-ratio in adult corpus callosum. Each data point is the average of 100 myelinated axons from one animal. n = 5 animals from each genotype. Unpaired t test. (F) Representative images of CC1 (red) and Olig2 (green) staining of corpus callosum (CC) of P16–P18 SRF-Flox and SRF-cKO mice. (Scale bar, 20 μm.) (G) Quantification of OPC density (CC1−Olig2+/mm2) in CC of P16–P18 SRF-Flox and SRF-cKO mice. n = 6 animals from each genotype. Unpaired t test. (H) Quantification of oligodendrocyte density (CC1+Olig2+/mm2) in CC of P16–P18 SRF-Flox and SRF-cKO mice. n = 6 animals from each genotype. Unpaired t test. (I) Representative images of CC1 (red) and Olig2 (green) staining of cortex of P16–P18 SRF-Flox and SRF-cKO mice. (Scale bar, 20 μm.) (J) Quantification of OPC density (CC1−Olig2+/mm2) in cortex of P16–P18 SRF-Flox and SRF-cKO mice. n = 6 animals from each genotype. Student t test. (K) Quantification of oligodendrocyte density (CC1+Olig2+/mm2) in cortex of P16–P18 SRF-Flox and SRF-cKO mice. n = 6 animals from each genotype. Unpaired t test.
