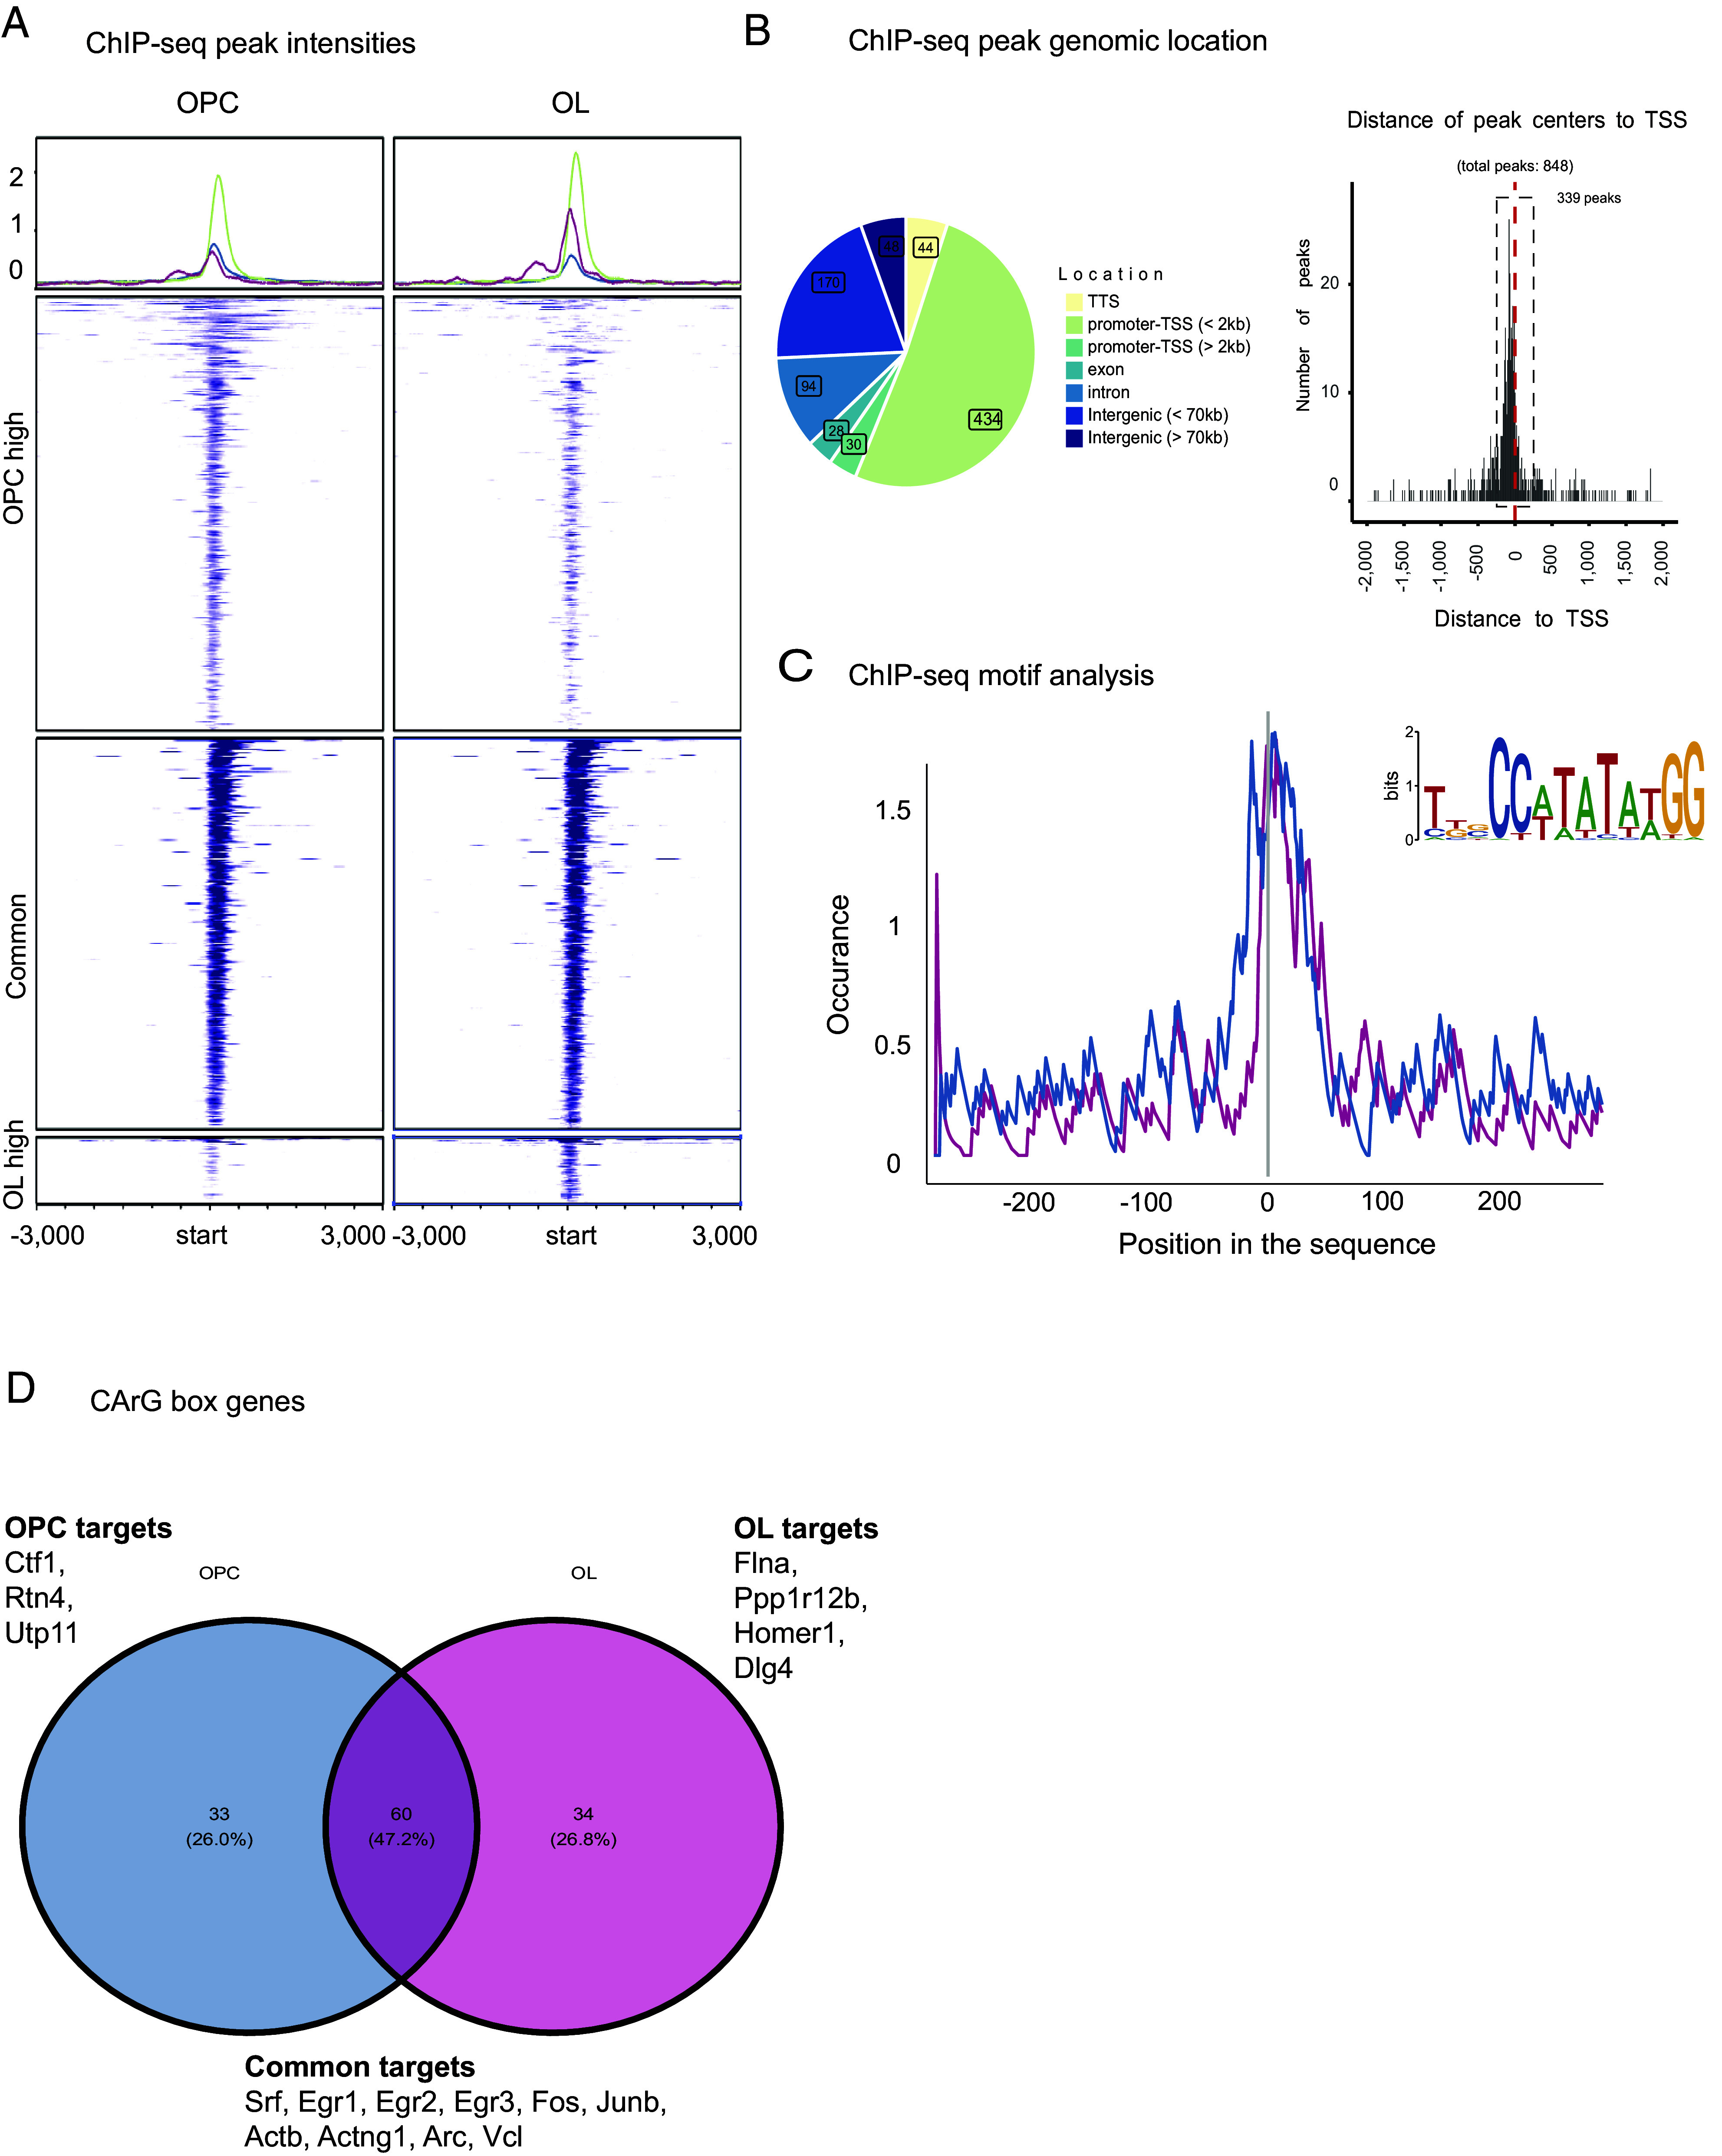
Fig. 3.

ChIP-seq identifies SRF target genes in OPCs and oligodendrocytes. (A) Heatmap of SRF ChIP-seq peak intensities in OPC and oligodendrocyte samples. OPCs n = 4, oligodendrocytes n = 3. (B) Distribution of genomic location of ChIP-seq peaks showing that most binding events localize to the promoter and TSS. (C) ChIP-seq motif analysis identifying CarG box, the SRF binding motif in OPC (blue), and oligodendrocyte (pink) peaks. (D) Venn-diagram of genes associated with the CarG box peaks in OPC and oligodendrocyte samples.
