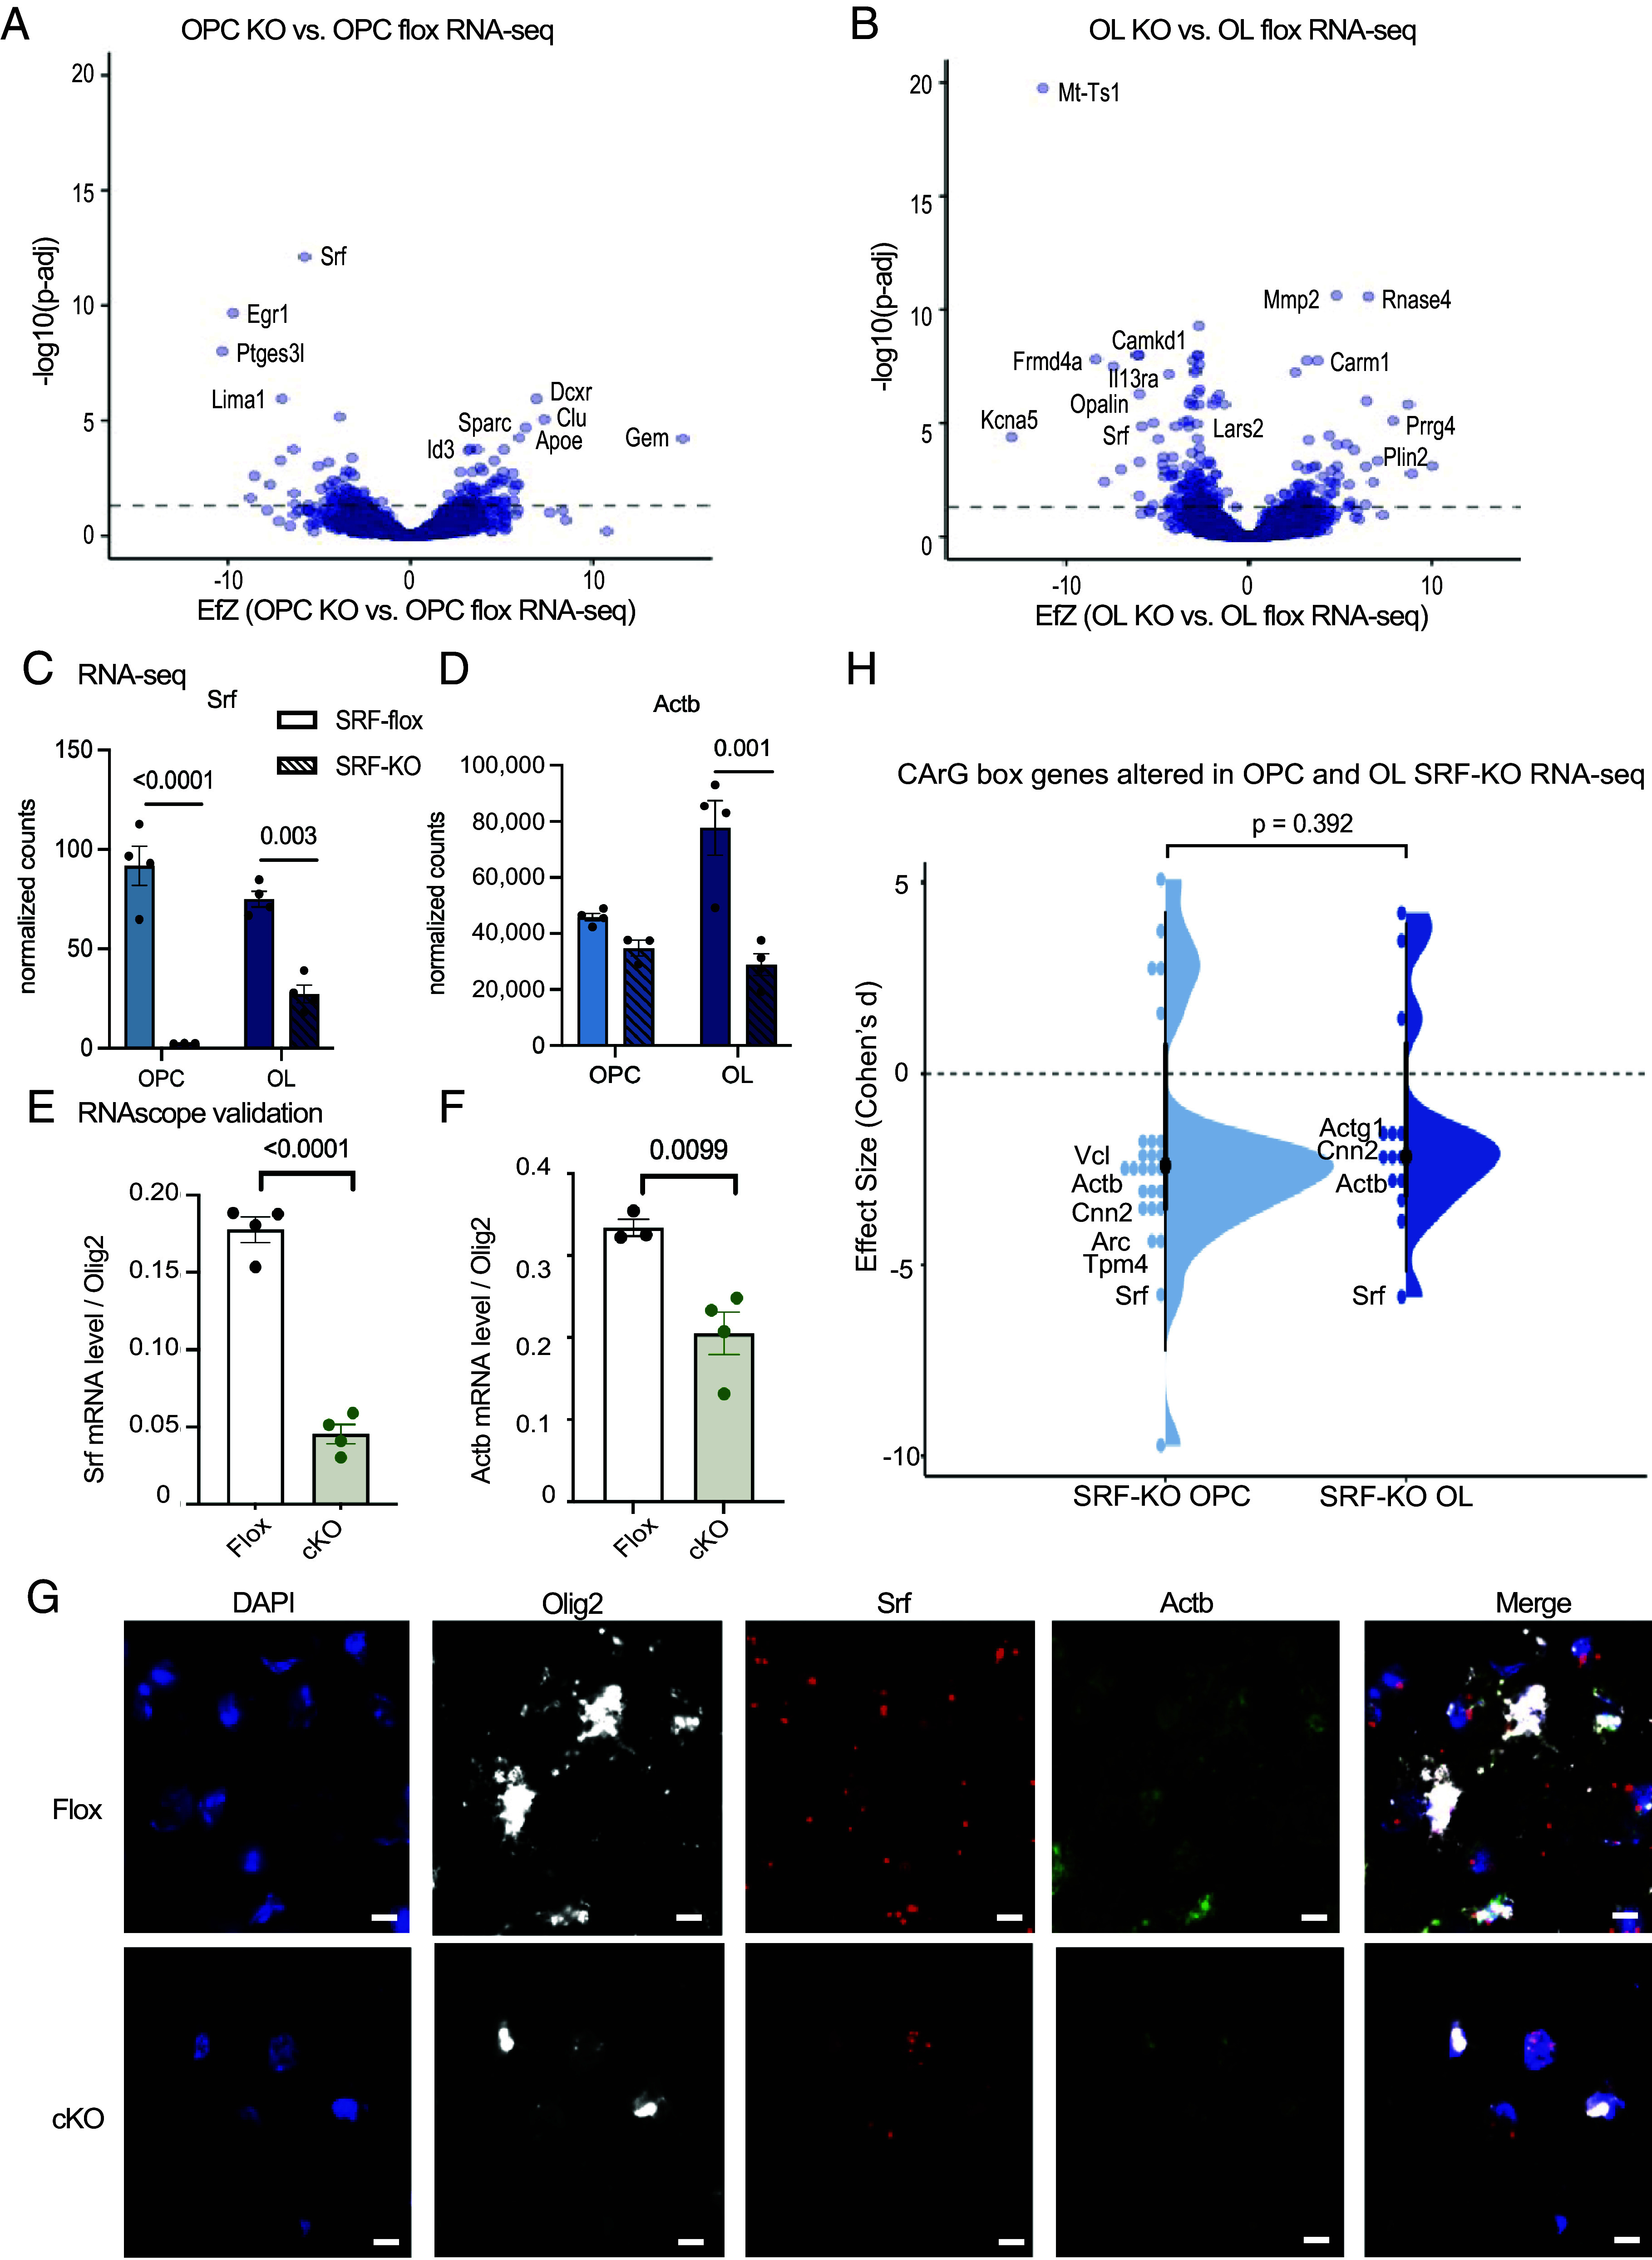
Fig. 4.

SRF regulates actin cytoskeleton gene expression. (A) Volcano plot of differentially expressed genes of SRF-KO OPCs vs. SRF-Flox OPCs. The dashed line represents Padj = 0.05. SRF-Flox n = 4, SRF-KO n = 3. (B) Volcano plot of differentially expressed genes of SRF-KO oligodendrocytes (OL) vs. SRF-Flox OLs. The dashed line represents Padj = 0.05. n = 4. (C) Normalized expression counts of Srf in SRF-Flox and SRF-KO OPCs and oligodendrocytes. OPC SRF-KO n = 3. All the rest n = 4. Statistics by DESeq2. (D) Normalized expression counts of Actb in SRF-flox and SRF-KO OPCs and oligodendrocytes. OPC SRF-KO n = 3. All the rest n = 4. Statistics by DESeq2. (E) Quantification of Srf expression levels in Olig2+ nuclei in the cortex of P16/P18 SRF-Flox and SRF-cKO mice detected by RNAscope. n = 4. (F) Quantification of Actb expression levels in Olig2+ nuclei in the cortex of P16/P18 SRF-Flox and SRF-cKO mice detected by RNAscope. n = 4. (G) Representative images of DAPI, Olig2, Srf, Actb, and merge channel in SRF-Flox and SRF-cKO mice. (Scale bar, 10 μm.) (H) Violin plot of CarG box genes in SRF-KO vs. SRF-Flox OPC and oligodendrocyte RNA-seq. Wilcoxon rank-sum test.
